
The "Set Offset" button is used to set the bar offset at which the cycle analysis will be performed. So, only price data to the left of the offset will be used for the cycle analysis and any price data to the right of the offset is not used or known by the cycle analysis process. The amount of price data used is determined by the Window size (see Menu Options). If at any time you change the offset, the current cycle analysis will be discarded and a new cycle analysis (based on the currently selected options) will be performed. The current offset is always displayed as either a dotted or solid grey vertical line in the cycleMultiTool indicator panel.
|
Note: When a spectrum is being displayed, the spectrum itself takes up a lot of real estate in the indicator panel, but the offset will always be visible in the upper portion of the indicator panel. |

To change the current offset, simply hold down your SHIFT key, click on the Set Offset button, and then double-click anywhere in the indicator panel.
|
Note: When clicking to set the offset you must click inside of the cycleMultiTool indicator panel. If you attempt to click in the price pane area the offset will not be set. |
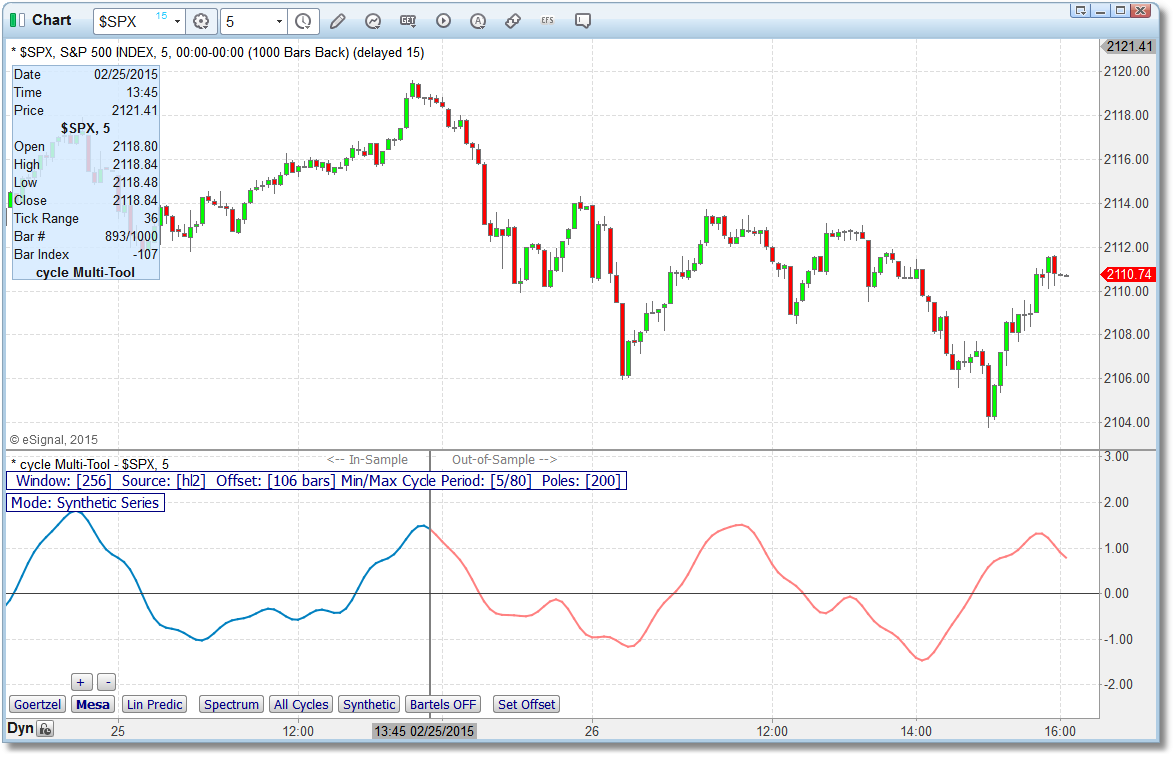
In the chart above we are displaying a Mesa synthetic series based on an offset that is approximately 107 bars back from the most current price bar (you can see the vertical grey line at the offset position). So only price data to the left of that vertical line is used in the cycle analysis.Specifically, since the Window Size is set at 256, and since the offset is at bar 107, then the block of data used in the cycle analysis would span from the bar at offset -362 to the bar at offset -107. In the image above the blue portion of the line is the "known" data while the red portion of the line represents a projection into the future based upon the cycle analysis.
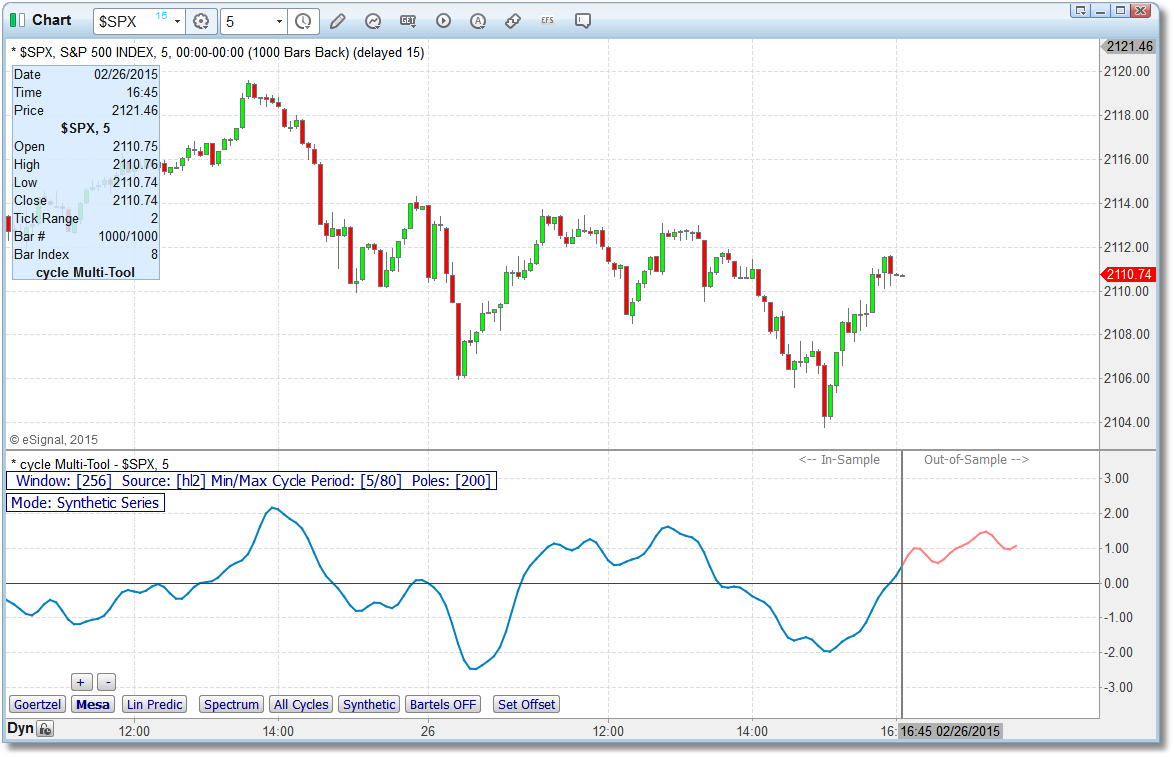
This next image is the exact same chart, however we have relocated the offset to the most current price bar. So once again the blue portion of the line represents the "known" data while the red portion of the line is a projection into the future. You can adjust how far the projections extend into the future in the cycleMultiTool indicator menu.
The offset mechanism obviously also applies to the Spectrum option as well.
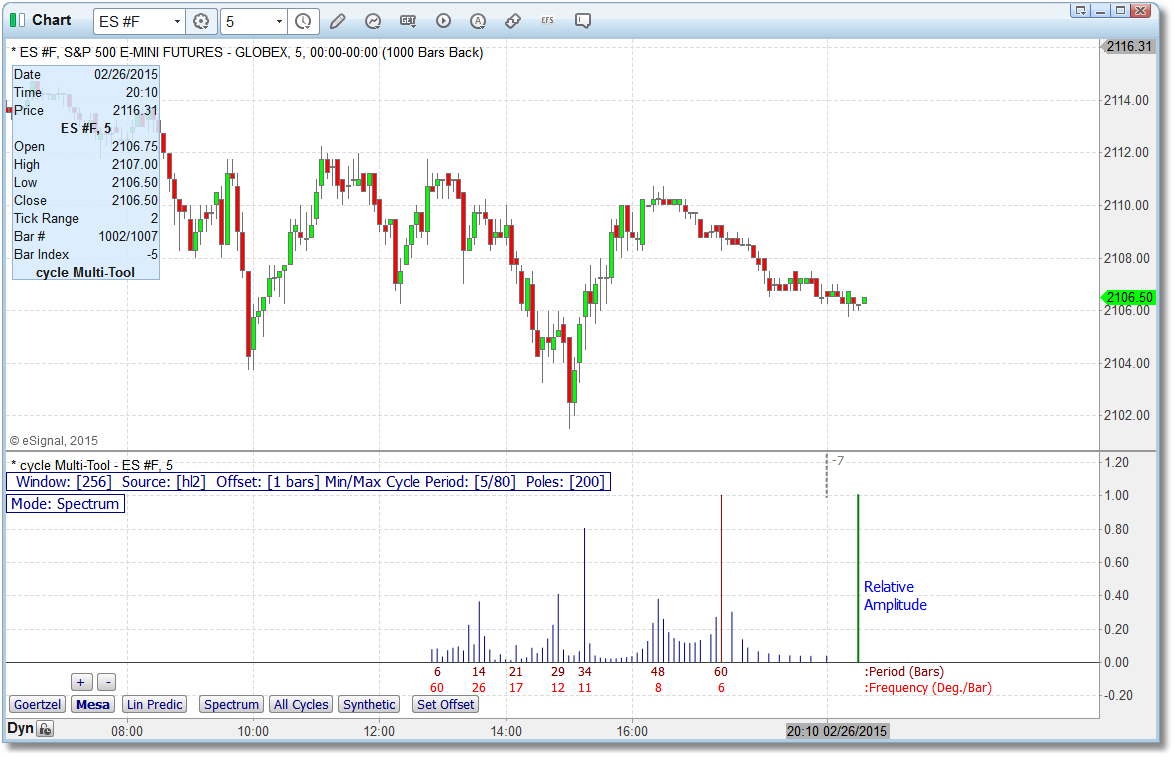
In the chart above, we are displaying a power spectrum and you can see that the offset is currently set at 7 bars back from the most current bar. So, 256 bars of data back from this offset are being used for the cycle analysis.
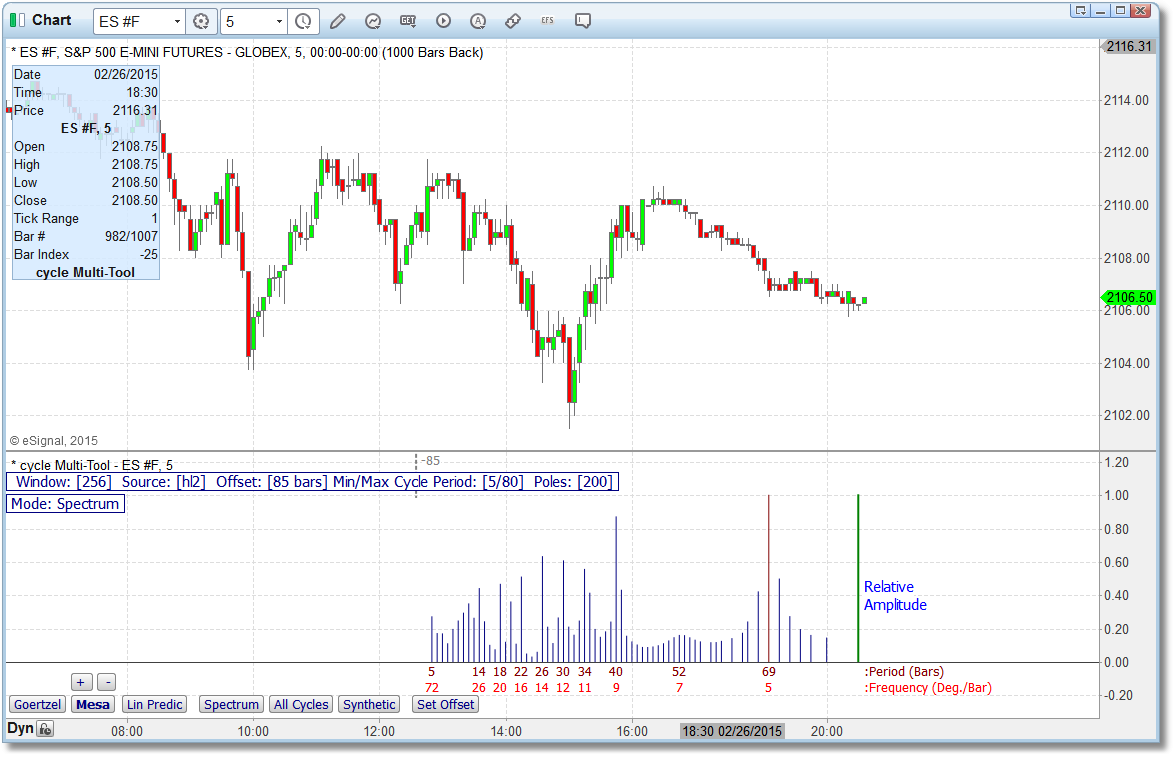
In this chart we have shifted the offset back from 7 bars to 85 bars. So same chart, same data but different bar offsets and, therefore, a different block of data being processed for cycle analysis.
