
The "Synthetic" option can be selected regardless of which cycle algorithm is currently active. When selected, it will create and display a synthetic composite of all of the cycles found based upon the currently selected offset.
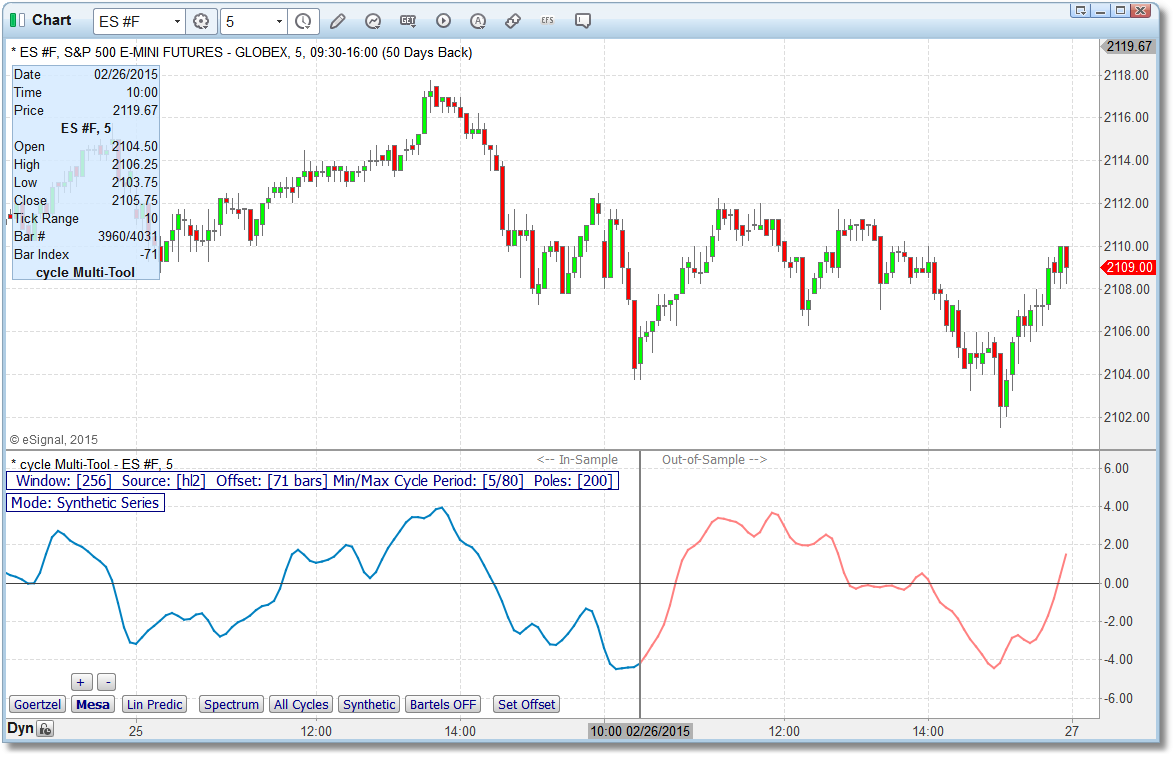
In the chart above, the Mesa algorithm has been selected (Mesa button is highlighted) and the Synthetic button has been clicked. A synthetic composite of all of the cycles discovered during cycle analysis is created and displayed. Each individual cycle is evaluated based upon relative amplitude and phase and then each of these individual cycles is combined into one synthetic series.
In the image above you can see that the currently selected offset (the vertical grey line) is at 10:00am on 02/26 and the synthetic series is projected into the future from that point. To put it another way, the cycle analysis process evaluated 256 bars (in the Information Bar you can see that our Window size is currently set to 256) up to and including the 10:00am bar on 02/26. It knows nothing about the price data that was collected after 10:00am on 02/26 and these data were not part of the cycle analysis. So the blue portion of the synthetic series represents known data (i.e., the price data that was used to perform the cycle analysis) while the red portion of the synthetic series represents a projection into the future based solely upon the cycle analysis. You can see in this case it did a pretty good job of forecasting the actual price action.
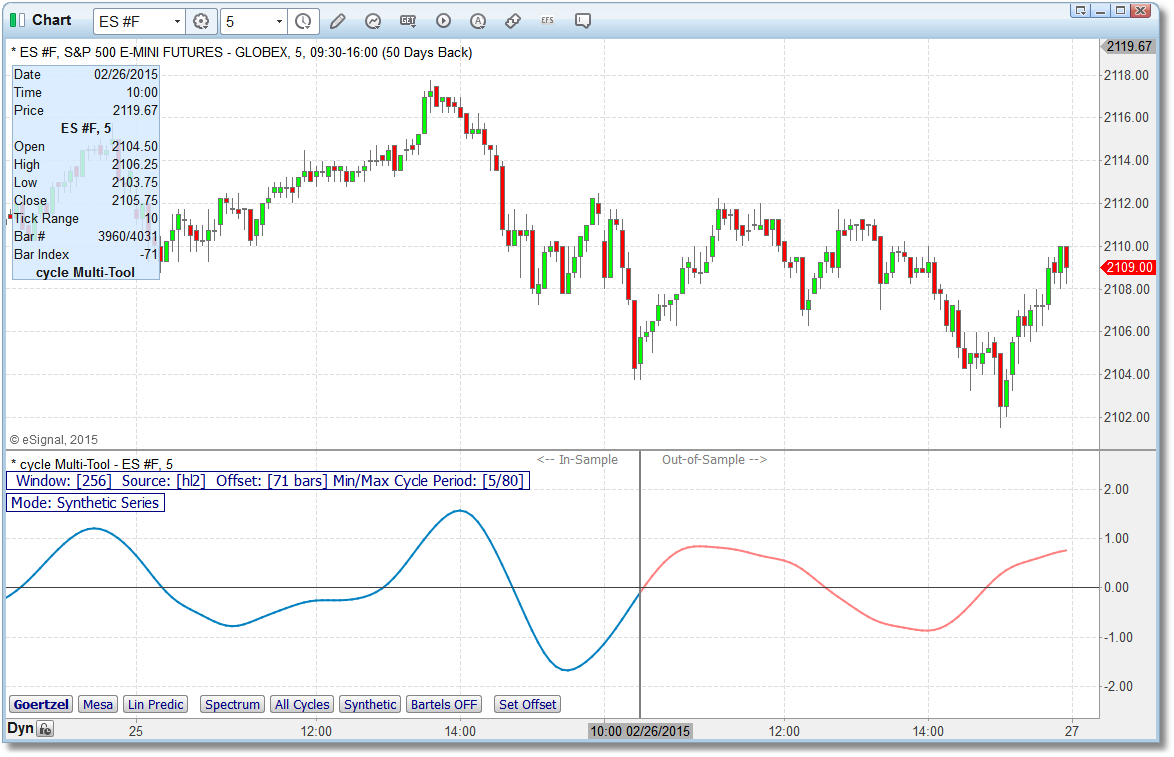
In the image above, we have simply switched from using the Mesa algorithm to the Goertzel algorithm (you can see that the Goerzel button is now highlighted). The offset remains the same as in the Mesa example.
Note that when either Goerzel or Mesa is the selected cycle algorithm, an additional button (Bartels) is displayed. As the name suggests, when activated it performs a Bartels analysis to filter the cycle data (remove noise). To turn on the Bartels filtering hold down your SHIFT key and click on the Bartels button (it should now display Bartels ON). Click the button again to turn off the Bartels filtering (button will display Bartels OFF).
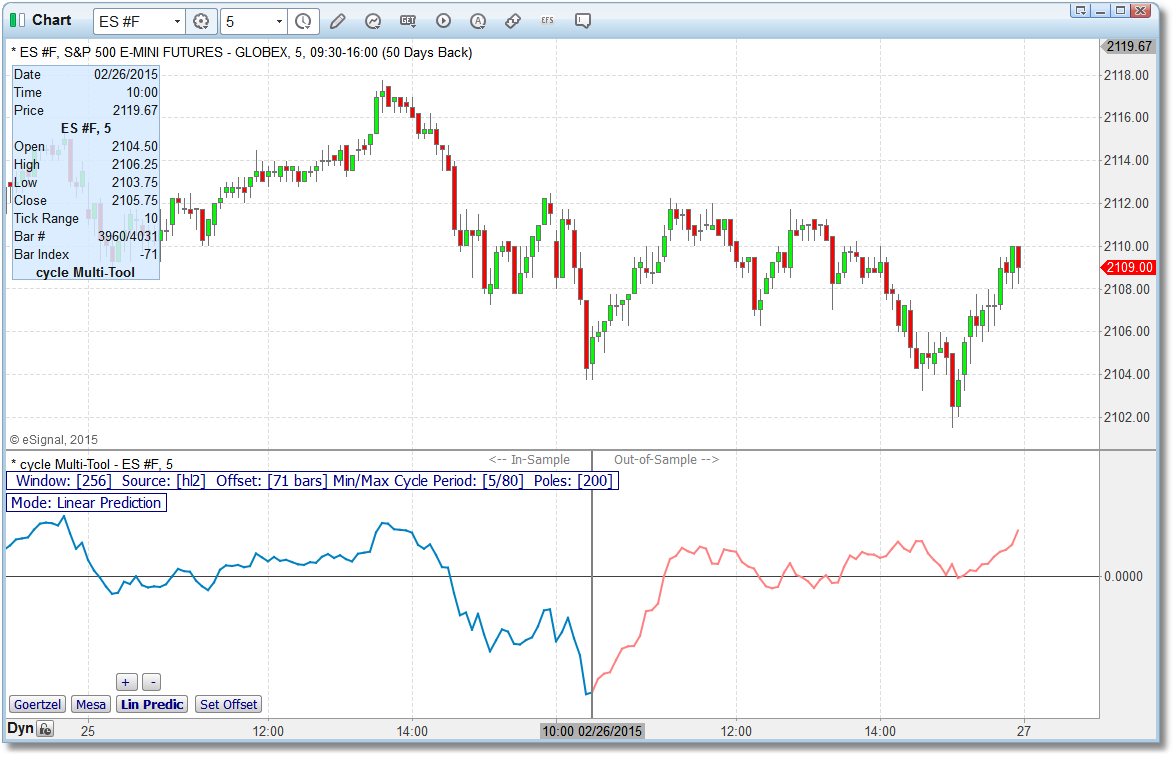
In the image above, we have switched to the Lin Predic algorithm. The +/- buttons that you see above the Lin Predic button allow you to adjust the number of Poles used in the calculation.
Usage |
As with selecting the cycle analysis algorithm, how you actually use the Synthetic series option is entirely up to you. In practice, though, we have found that setting the offset just past a recent swing high or swing low in the price data is the most practical application since, in addition to providing you with a future projection, it also provides you with an out-of-sample period in which you can compare the synthetic projection with what actually transpired in the price data. Remember, the cycle analysis process only uses price data to the left of the offset...it knows nothing about the price data that is to the right of the offset.
For example, in the chart image below we have set the offset very near the most current price bar. Obviously the in-sample Synthetic series matches very well. We would expect it to since that price data was used in the actual cycle analysis. However, we have no information on which to gauge the possible accuracy of the future projection. In this scenario we basically have to take in on faith.
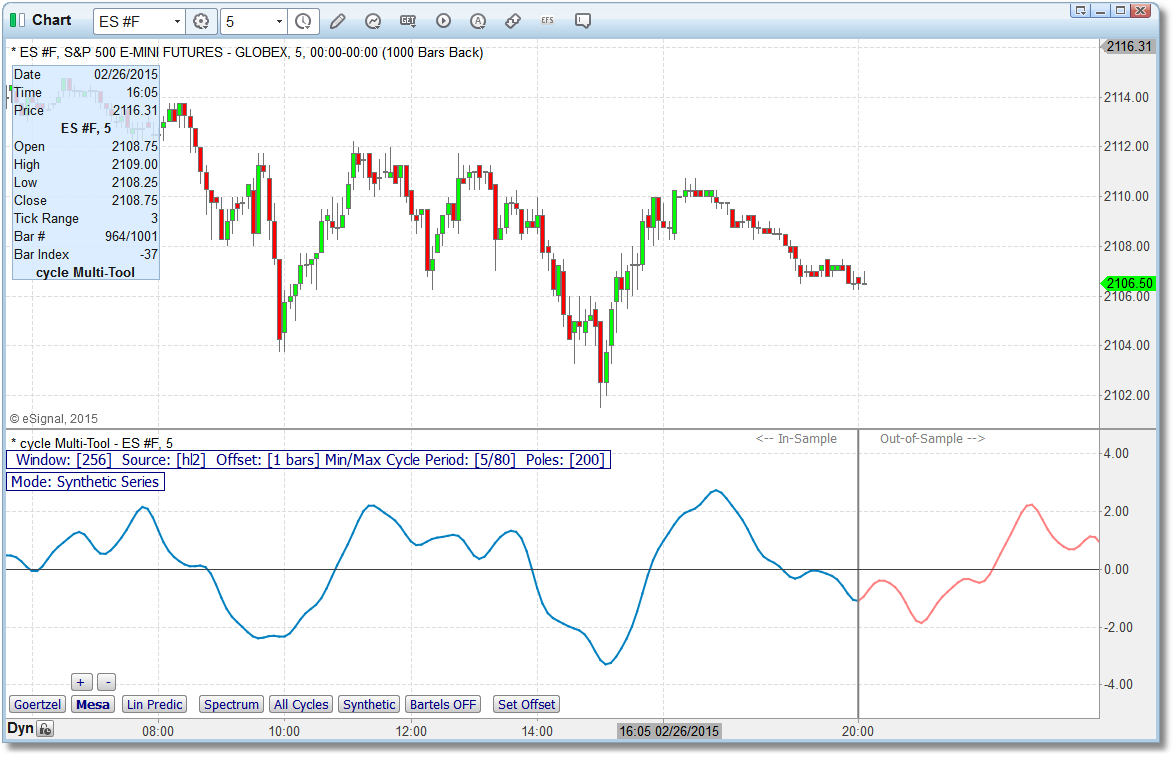
Offset at current price bar.
In this next chart image below (same chart) we have set the offset just past the most recent swing low. In this scenario we still have a future projection, but we also have an out-of-sample period where we can compare the Synthetic projection to the actual price action. Now, depending upon what happens in the market and in the news, both of these projections may very well be entirely off-base...we have no way of knowing for sure. However if we use the 2nd approach (i.e., where we set the offset just past a swing high or swing low) we at least have an out-of-sample period that we can use to gauge the efficacy of the Synthetic series produced by the cycle analysis. If the Synthetic series tracks the out-of-sample period very closely then we stand a good chance that it will continue to project the price action correctly for at least a certain number of bars into the future.
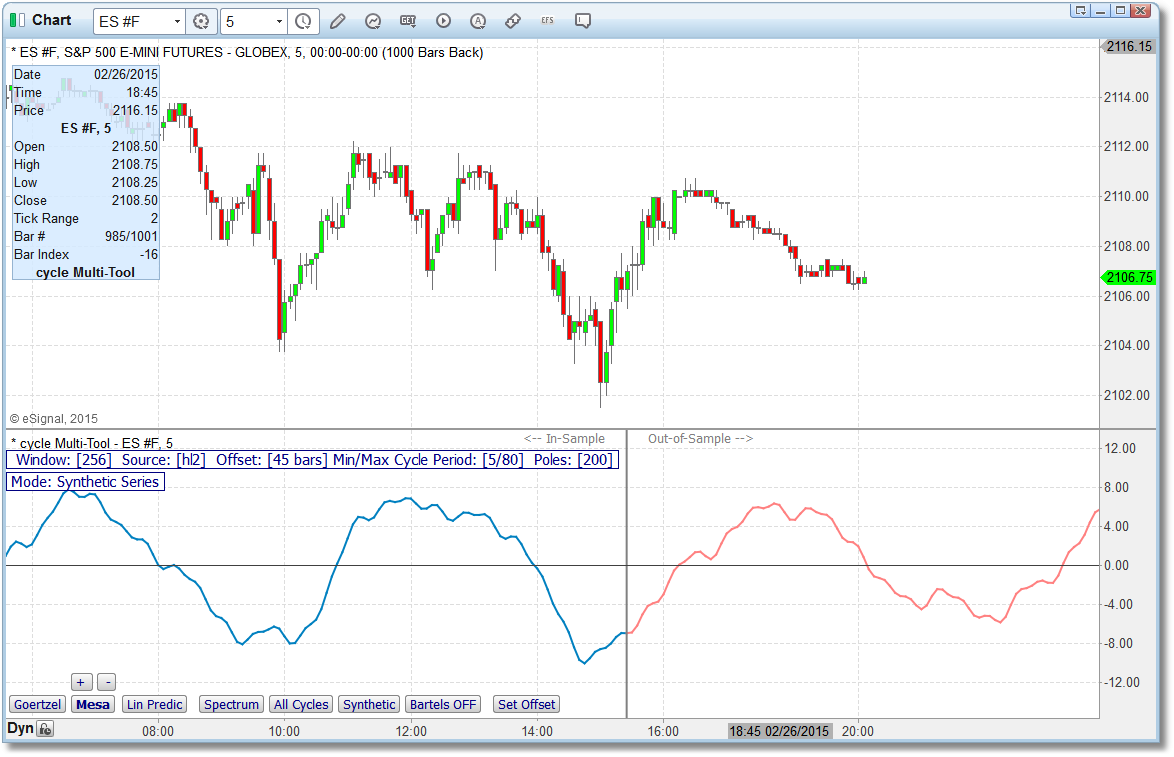
Offset just past most recent swing low.
A good approach, if you have the time, is to set the offset at the most recent swing high or low and compare the Synthetic series to the out-of-sample period. Then move back to the next swing high or low and repeat. Keep doing this for a few swings and pick the offset that delivers the best out-of-sample performance. If you are using this intraday then each time a new intermediate or major swing is formed, take a few minutes to test new offsets.
