
The "Spectrum" option can be selected if the currently selected cycle algorithm is either Goertzel or Mesa. When selected, it will display a power spectrum histogram based upon the current offset (anchor point).
In the chart above, the Mesa algorithm has been selected (Mesa button is highlighted) and the Spectrum button has been clicked. A power spectrum histogram is displayed based upon the cycle analysis performed up to, and including, the selected bar offset. In this case the offset is 44 bars back from the most current bar. The current offset is always displayed near the top of the indicator panel as a vertical dotted or solid line. The spectrum itself displays the cycles found in the data based on relative amplitude, and highlights the strongest cycle in a different color (default being red). In the chart above the strongest cycle found was the 47-period cycle, but the 9, 13, 18, 23, 26, 31, 36, and 53 period cycles were also identified.
|
Note: The spectrum histogram display is simply a snapshot showing the relative amplitude of all of the cycles found during the cycle analysis process. As far as the x-axis display, it is not tied in any way to the price data that is displayed in the price pane. By that I mean that, for example, the red 47 cycle peak in the snapshot above is not associated in any way with the price bar that happens to be directly above it. It simply means that, within the window of data that was analyzed, the 47 cycle period was the strongest cycle found. |

When in "spectrum" mode you can also display any individual cycle by holding down the SHIFT key and single-clicking on the cycle number itself (i.e., the numbers that you see displayed below the spectrum histogram in the chart above). So, for example, if we click on the 47 in the spectrum above (i.e., to select the 47-period cycle), we will get a plot of just the 47-period cycle plotted in the indicator panel, in the correct phase.
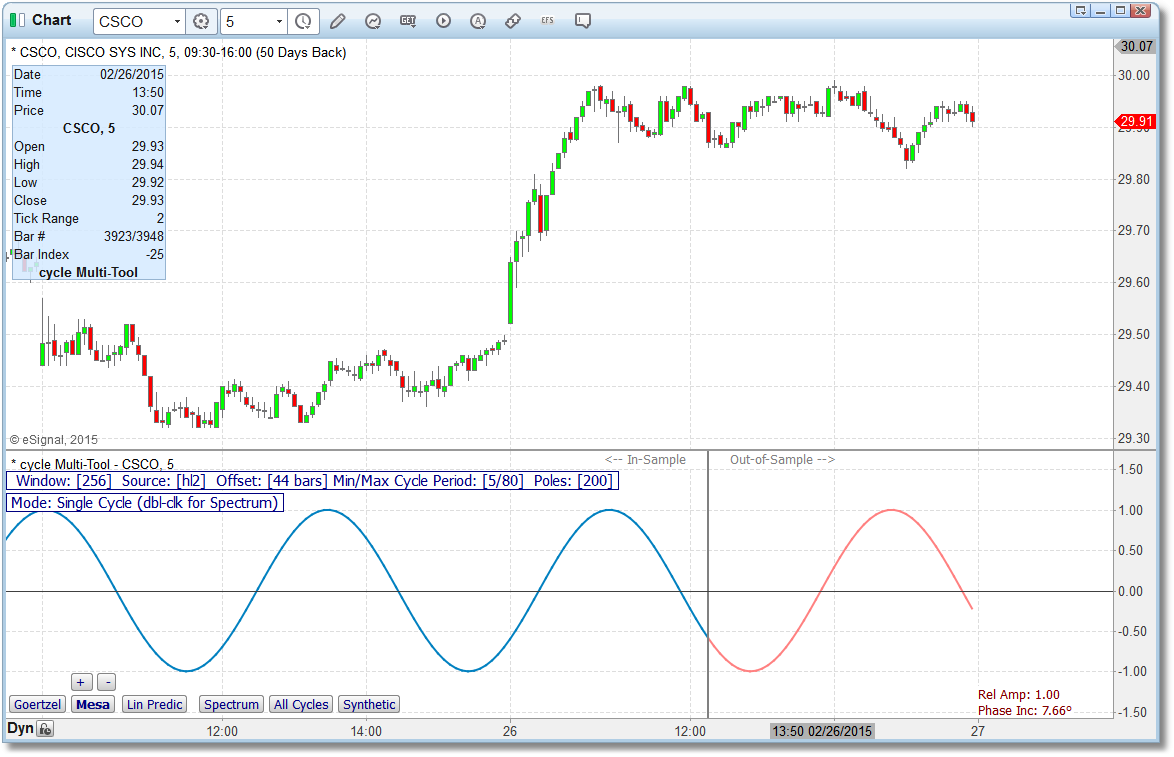
This "single-cycle" view will always display the selected cycle in the correct phase, and at the bottom-right of the indicator panel it will display this cycle's relative amplitude along with it's phase increment, in degrees.
To return to the spectrum display, simply hold down your SHIFT key and double-click anywhere inside of the indicator panel.
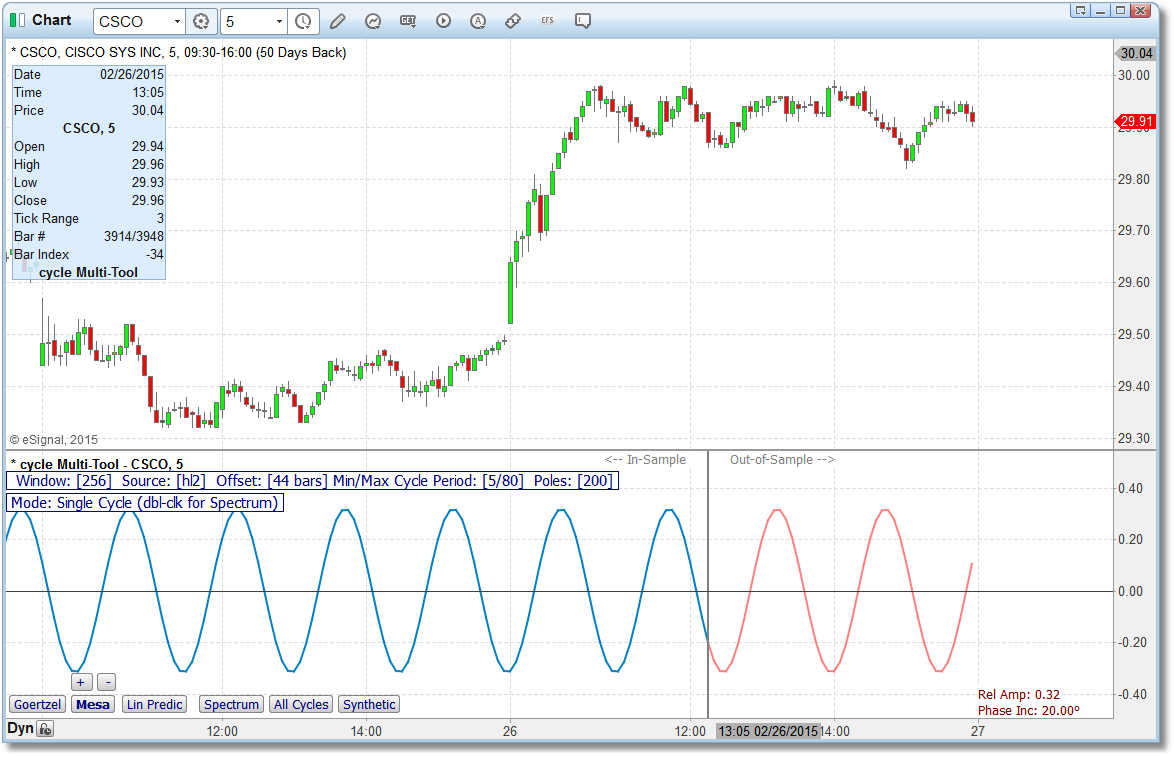
In the image above, we returned to the spectrum display, and then clicked on the 18-period cycle. So now we are looking at the 18-period cycle in the correct phase, based upon the currently selected offset (see the grey vertical line)
