The Watchlist Interface
|
Note: marketDirection Monitor is designed to be used in both a watchlist and a chart simultaneously, with the watchlist linked to the chart. Using marketDirection Monitor only in a watchlist, or only in a chart would not be very productive. |
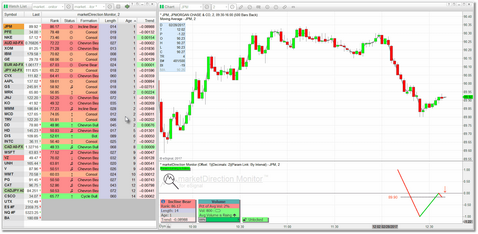
The watchlist component of marketDirection Monitor is the workhorse. It will monitor and update each row of the watchlist as new formations are found, and will track historical formations for up to 15 bars. As mentioned in the Overview section, all updates take place at the close of a bar and any formations found are intended to be applied to the current bar (i.e., the most current price bar is not included in the analysis). The columns displayed by marketDirection Monitor when running in a watchlist are as follows:
This is a numerical value, between 0 and 100, that is assigned during the analysis process. The rank is a measurement of how well the price action analyzed fit the 'template' for that particular formation group. A higher rank does not necessarily mean that a particular formation is likely to produce a better outcome than one with a lower rank. However, a formation with a higher rank is likely to be more visible to you and any other traders interested in the same security.
|
|||||||||||||
Status: |
Provides information about the current formation using symbols and colors:
|
||||||||||||
Formation: |
The actual name of the formation. The background color will indicate the directional bias.
|
||||||||||||
Length: |
The length of the complete formation, in bars. If you want to focus only on larger formations you can use this column as a filter.
|
||||||||||||
Age: |
The age of the formation, in bars. An age of 1 means that the formation was just created. An age of 15 means the formation was created 15 bars ago. (See also: Formation Age)
|
||||||||||||
Trend: |
The slope of the price action within the confines of the formation itself. Background color is used to indicate the direction.
|
The watchlist can be sorted on any of the columns above, and multi-column sorting is possible. A good multi-column sort to consider would be to sort first on the Age column (in ascending order), and then on the Rank column (in descending order). Any columns that you do not need can be removed by right-clicking in the column header and choosing the Hide menu option. You can also adjust the order of the columns by clicking on a column header and dragging it left or right. All of the cosmetics can be adjusted via the parameters menu. See the Settings section for details on these options.
Getting Started
The easiest way to get started is to pull up one of the marketDirection Monitor Demo pages that were included as part of the installation (see Demo Pages). Which one you select is entirely up to you. Once you have loaded one of the pages you can customize it as needed and save it under a new name. The benefit to using one of the pre-installed pages as your starting point is the fact that the watchlist/chart symbol/interval linking has already been correctly set up and the watchlist and chart components are already attached to the correct eSignal Time Template.
|
To load one of the pre-installed marketDirection Monitor pages please follow these steps: |
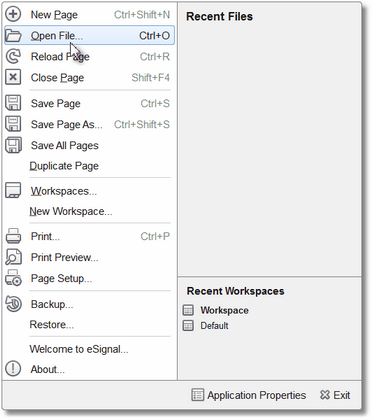
•Click on the blue eSignal icon at the top-left of the eSignal program and click on the Open File... option.
|
|
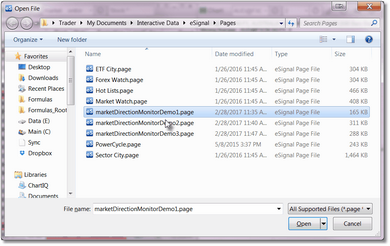
•You should now be looking at the contents of the Pages folder.
•Scroll down until you see the marketDirection Monitor Demo pages. Select one and click on the Open button at the bottom-right of the dialog. |
|
•The page you selected will be loaded into eSignal. You might need to adjust the height/width of the chart and watchlist components to match your particular monitor size and resolution.
•Regardless of which marketDirection Monitor Demo page you select, you will see that the watchlist component(s) are already linked to their corresponding chart component(s). If you click on a row in the watchlist the correct information for that symbol and interval will be displayed in the chart.
•You can sort the watchlist on any of the marketDirection Monitor columns and you can also remove any of the columns that you don't feel you need.
•You can now customize the page by adding additional (or completely different) symbols (see Adding List of Symbols), selecting a different bar interval, and adjusting the marketDirection Monitor parameters to suit your needs.
•When you are done be sure to save the page under a new name. |
|
To access the marketDirection Monitor watchlist parameters menu where you can view and edit program settings, please follow these steps: |
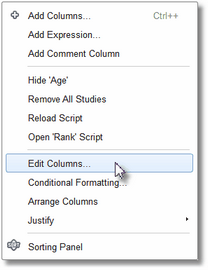
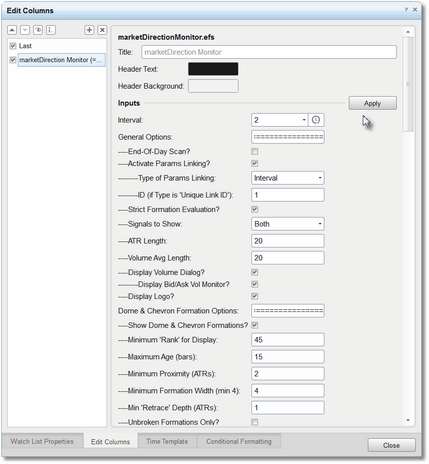
•Click on the marketDirection Monitor title bar in the watchlist, and then right-click and select the Edit Columns menu option.
|
|
•You will now be looking at the Edit Columns dialog.
•You can scroll up or down through the available parameters and make any changes needed.
•Once you are done with your changes, you must click on the Apply button that you see at the top-right of the available parameters.
•For more information on the available parameters please review the Settings section.
•When the params linking feature is activated, any changes you make to the parameters in the watchlist component will automatically be delivered to the chart component so no need to make those changes in both places.
•See the note below regarding clicking on the Apply button. |
|
Whenever you make changes to the marketDirection Monitor indicator running in a watchlist you MUST click on the Apply button to accept and apply the changes. Just clicking on the Close button at the bottom-right of the Edit Columns dialog will not apply the changes. |
Covering all of the features and capabilities available in eSignal charts and watchlists is beyond the scope of this document. You can find detailed information on both, as well as several tutorials, on the eSignal Knowledgebase website.
See Also:

