Cycle
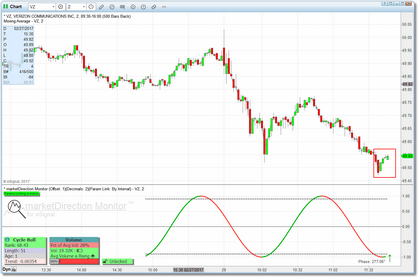
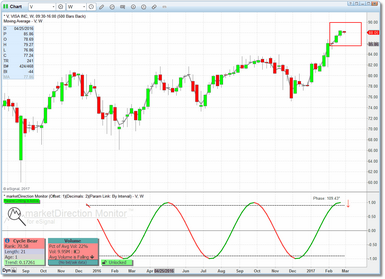
Cycle formations are less of a true 'formation' and more of an observation. As part of the underlying process all price action is evaluated for any strong cyclical activity and, if it is found, it is placed in this category. Specifically we are looking for price action that is very near either a cycle top or a cycle bottom. If the cycle is strong (and generally clearly visible once you are alerted to it) the bias would be towards the cycle continuing for at least some period of time into the future. So a bullish Cycle formation is expected to lead to a gradual rise in price and vice-versa for a bearish Cycle formation.
In most cases the move is not immediate. If you see a particularly good looking Cycle formation you should make a note of it (in case the formation is no longer displayed, or possibly superseded by a different formation) and check in on it every few bars or so to see if it is beginning to make a clear move in the direction of the cycle.
In the examples above, the highlighted region (red rectangle) indicates the area in which we expect the reaction. With Cycle formations the reaction is rarely immediate and generally slow to develop. The Cycle formation may well extend for several bars before price starts to turn.
|
Note: If you would like to actually see the inflection point zones drawn in the price pane as in our examples above, then see the Chart Zone Tool section. |
As part of the Cycle formation plot the phase, in degrees, of the detrended and normalized price data will be printed above/below the cycle plot in the indicator pane.
Alerts
Current (i.e., Age = 1) Cycle formations, by default, will generate an alert condition whenever price moves above the prior bar's high (for a bullish Cycle) or below the prior bar's low (for a bearish Cycle). Aged (i.e., Age > 1) Cycle formations will generate an alert condition when price moves past the original alert price level AND current bar has exceeded prior bar. So, for a bullish alert, price would have to be above the original alert price high and the current bar high would have to be above the prior bar high (reverse for bearish alert).
You can also use the two Alert Padding parameters to delay the alert condition until a more significant move has taken place. See the Alert Padding section for details.
This alert condition will show up immediately in the watchlist component (i.e., ♫ in the Status column). If pop-up and/or audible alerts are turned on then those will be generated as well. Email alerts are also available, but only in the chart component. See Settings for more information on the alert-related parameters.
|
Note: If a solid black circle (●) is displayed in the Status column in the watchlist along with the alert condition (♫) this indicates that price has both reached the inflection point is trading at volume that is above the average volume for the security. This might indicate that price is moving rapidly in the desired direction. |
Parameters
The parameters that can be adjusted for the Cycle formation are:
•Minimum Rank for Display
•Maximum Age
•Minimum Cycle Length
•Maximum Cycle Length
•Full Cycles to Test (40 or smaller)
•Full Cycles to Test (41 or larger)
•Alert Padding - Type
•Alert Padding - Factor
See the Settings section for more detail on these parameters.


