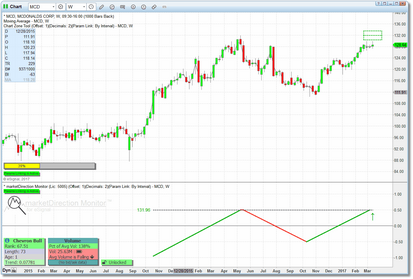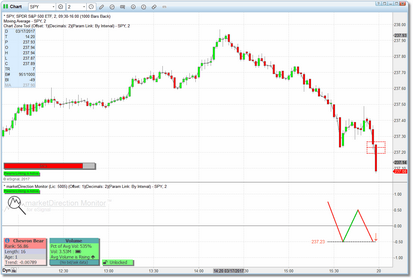
Chart Zone Tool (optional)
The Chart Zone Tool is an additional indicator that we provide (you can find it in the marketDirection Monitor formula folder) that will draw the inflection point zone in the price pane for the specific formation being displayed in the marketDirection Monitor indicator pane. It also incorporates an Activity Monitor gauge that will display the relative pace at which trades are coming in for the charted security. The Chart Zone Tool is optional and whether you use it or not is entirely up to you.
Activity Monitor
The Activity Monitor gauge, which is a component of the Chart Zone Tool and can be toggled on/off independently, will display the relative pace at which trades are coming in. It uses colors to indicate low, average, high, and very high activity in the security. By default it will be displayed just above the Params Link Indicator in the lower-left of the chart pane, but you can adjust the pixel coordinates at which it will be displayed, as well as the font size used, and the width of the gauge.
To determine the pace of trade activity, the Activity Monitor counts trades in a 5-second sliding window and continuously compares the count in the current window to those that preceded it. It then assigns a color and a value based on this comparison. Again, to be perfectly clear, the Activity Monitor is looking only at the number of trades coming through and not the volume of each trade. So, for purposes of the Activity Monitor, 1000 trades for 1 share each coming through in a 5 second period would register as relatively high activity whereas one trade coming through for 5000 shares during that same period would register as very low activity. For volume-based information you should refer to the Volume Dialog. Please note that the Activity Monitor does require approximately 30 trades to come through in order to prime the calculation, so when you add a new symbol to the watchlist (or change the bar interval of the watchlist) there will be a delay before the Activity Monitor begins to display results.
As price approaches the inflection point designated by the formation, it is often difficult to tell if activity is increasing just by looking at the price chart. The Activity Monitor gauge makes this very easy to see.
The Chart Zone Tool requires that the watchlist component of marketDirection Monitor is running (i.e., it gets it's zone and activity information directly from the watchlist) and it's params linking settings must match those of the watchlist component. When it is correctly paired with a watchlist component, the bright green Params Link Indicator will be displayed at the bottom-left of the chart pane. All cosmetics, as well as the width and height of the "zone" drawn on the chart can be adjusted via the indicator settings menu.
|
Note: The Chart Zone Tool is included in all of our Demo Pages. If you prefer not to use it, just go into Edit Chart and either uncheck it or remove it completely. |
See Also:


