The Chart Interface
|
Note: marketDirection Monitor is designed to be used in both a watchlist and a chart simultaneously, with the watchlist linked to the chart. Using marketDirection Monitor only in a watchlist, or only in a chart would not be very productive. |
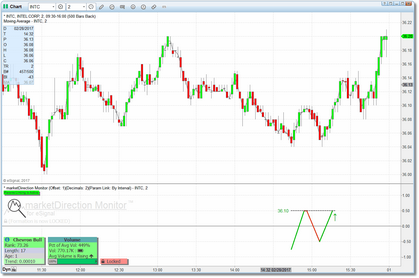
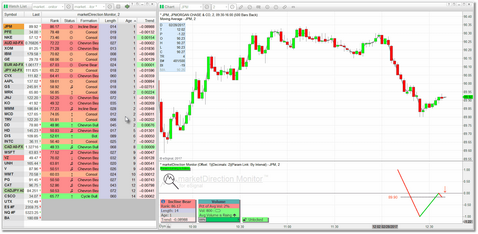
The chart component of marketDirection Monitor allows you to visualize the various formations and analyze a specific formation in the context of recent and historical price action. This is also where you would apply any tools/indicators that you use as part of your specific trading methodology. The chart component of marketDirection Monitor will almost always be linked to a watchlist component, so when you click on a row in the watchlist the formation information for that particular symbol and interval will be displayed in the chart. The chart component of marketDirection Monitor operates in its own indicator pane and is comprised of the following:
Formation: |
The actual formation will be displayed below the corresponding section of price bars from which the formation was detected.
|
||||||||
Params Link Indicator: |
Displayed just below the indicator title on the left-hand side of the indicator pane.
It will be displayed with a bright green background if params linking is active, a bright yellow background if params linking is active but the interval of the chart does not match the interval of the watchlist, or not displayed at all if params linking is not currently active. (See also: Params Linking)
|
||||||||
Info Dialog: |
Displayed at the bottom-left of the indicator pane this dialog provides information about the formation currently being displayed.
The items displayed are:
•Formation Name •Rank •Length •Age •Trend
These are the same items that are displayed in the watchlist columns. (See the Watchlist section for more information on these items).
Note: you can hold down your SHIFT key and then click on the info icon that you see to the left of the formation name and the version of marketDirection Monitor that you are currently running will be displayed.
If you hold down SHIFT and click on the while this version window is displayed, it will launch the online User Guide (this document). Just hold down SHIFT and click on the to close the version window.
|
||||||||
Displayed just to the right of the Info Dialog.
This dialog displays volume-related information for the symbol/interval in the chart:
The Volume Dialog is optional and can be turned off via the Settings menu if it is not needed. Note that the Volume Dialog will not be displayed at all for symbols or intervals that do not report volume information.
|
|||||||||
Displayed just to the right of the Volume Dialog, the lock button allows you to 'lock' a formation in place thus preventing any new formations from overwriting it.
You might want to do this if you are interested in a particular formation and how the price action will develop, and you do not want to take the chance that the formation will be removed or replaced by the system.
To lock a formation, hold down your SHIFT key and then click on the button. The button will turn from green to red and the text will change from "Unlocked" to "Locked". The formation will remain locked until you explicitly unlock it. To unlock a formation just hold down your SHIFT key and click on the button again. Keep in mind that when a formation is locked, no new formations will be considered and no new alerts will be generated. Also, the Age field does not increment when a formation is locked.
|
To better visualize the various formations in the price data it can be useful to plot a 2 or 3 period moving average of the closing price in the price pane (we do this in our marketDirection Monitor Demo pages). Most formations should be fairly easy to see in the price action, but with thinly-traded securities or the currencies with large wicks, it can be difficult to clearly 'see' all formations and the moving average helps to make them clearer.
All of the cosmetics can be adjusted via the parameters menu. See the Settings section for details on these options.
|
Note: Remember that if params linking is active, the chart component of marketDirection Monitor takes most of its settings (pretty much all except the cosmetic settings) directly from the watchlist component. If you go into the eSignal Edit Chart dialog and adjust the parameters, the chart component of the indicator will ignore your changes and continue to use the settings that the watchlist instructs it to use. If you want to directly control the parameters in the chart component of marketDirection Monitor you MUST first uncheck the "Activate Params Linking?" setting in the chart component's parameter menu.
Also, if you ever want to run the chart component of marketDirection Monitor standalone (i.e., not attached to a watchlist) then you should definitely uncheck the "Activate Params Linking?" setting in the parameter menu. |
End of Day Scan Mode
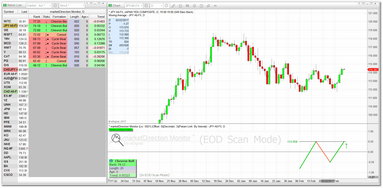
If you pull up the marketDirection Monitor parameter menu you will see that one of the very first options is End-of-Day Scan?. This option was added primarily for users who operate in the Daily bar interval and it allows them to view, after market close, any formations that will be viable for the next trading day. The reason this is required is because, in eSignal, a bar is not considered closed until the first tick of the next bar arrives...so we need to force the system to include the most current bar so that it can display any formations that will be in place for the next bar. When this box is checked the most current price bar will be included in the analysis and all alert features are disabled. In addition, a message indicating that the system is currently in EOD Scan Mode will be clearly displayed in the marketDirection Monitor indicator running in the chart. Be sure to uncheck the End-of-Day Scan? option in the settings menu when you are done. See Settings for more information.
Getting Started
The easiest way to get started is to pull up one of the marketDirection Monitor Demo pages that were included as part of the installation (see Demo Pages). Which one you select is entirely up to you. Once you have loaded one of the pages you can customize it as needed and save it under a new name. The benefit to using one of the pre-installed pages as your starting point is the fact that the watchlist/chart symbol/interval linking has already been correctly set up and the watchlist and chart components are already attached to the correct eSignal Time Template.
|
To load one of the pre-installed marketDirection Monitor pages please follow these steps: |
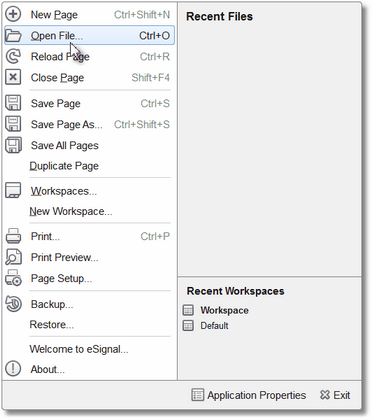
•Click on the blue eSignal icon at the top-left of the eSignal program and click on the Open File... option.
|
|
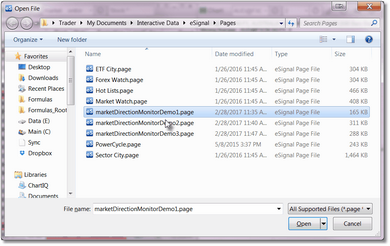
•You should now be looking at the contents of the Pages folder.
•Scroll down until you see the marketDirection Monitor Demo pages. Select one and click on the Open button at the bottom-right of the dialog. |
|
•The page you selected will be loaded into eSignal. You might need to adjust the height/width of the chart and watchlist components to match your particular monitor size and resolution.
•Regardless of which marketDirection Monitor Demo page you select, you will see that the watchlist component(s) are already linked to their corresponding chart component(s). If you click on a row in the watchlist the correct information for that symbol and interval will be displayed in the chart.
•You can sort the watchlist on any of the marketDirection Monitor columns and you can also remove any of the columns that you don't feel you need.
•You can now customize the page by adding additional (or completely different) symbols, selecting a different bar interval, and adjusting the marketDirection Monitor parameters to suit your needs.
•When you are done be sure to save the page under a new name. |
|
To access the marketDirection Monitor chart parameters menu where you can view and edit program settings, please follow these steps: |
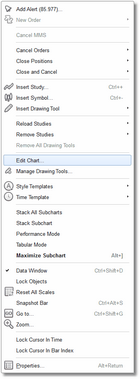
•Click anywhere in the chart and select the Edit Chart option from the pop-up menu.
|
|
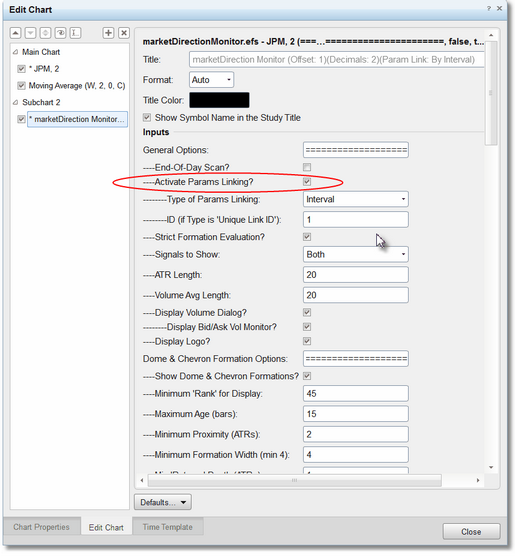
•You will now be looking at the Edit Chart dialog.
•You can scroll up or down through the available parameters and make any changes needed.
•For more information on the available parameters please review the Settings section.
•Don't forget about params linking! If activated, the chart component of marketDirection Monitor will get most of its parameters from the copy running in the watchlist and it will ignore any changes (other than cosmetic) that you make in the Edit Chart dialog. If you need full control over the chart indicator parameters you MUST uncheck the 'Activate Params Linking?' check-box under General Options. |
See Also:


