Zone Lines
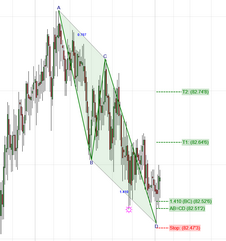
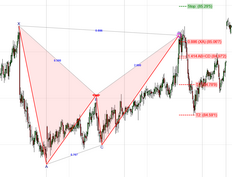
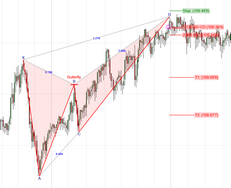
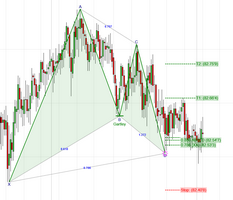
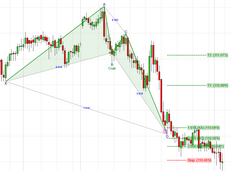
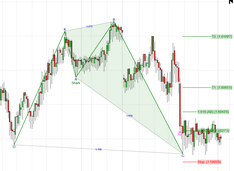
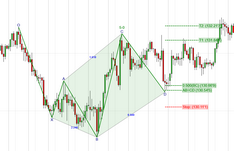
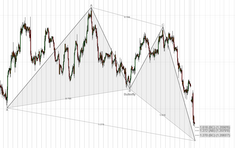
When displaying Pending and Confirmed patterns, horizontal reference lines will be drawn at price levels that are relevant to that particular pattern, and we refer to these as zone lines. These zone lines define the Potential Reversal Zone (PRZ).
Zone lines are drawn as dashed lines, and the ratio and price level are displayed at the end of each line. The length of these zone lines is controlled by the Zone Line Extension option under Settings. The default is 10 bars in length. If you do not wish to display the zone lines then set the Zone Line Extension parameter to 0.
We also have a few cosmetic options available. You can choose to reverse-highlight the zone-line text (as we have done in the examples below), and you can also draw a vertical line to connect all of the horizontal zone lines which can make it a bit easier to see which pattern a group of zone lines belongs to. You can also control the size of the text via the Font Size option also found under Settings.
Note that the target lines (i.e., T1 and T2) are extended further than all of the other zone lines. By default all target lines are extended by an additional 10 bars, but you can adjust this in Settings.
For most patterns we display the following zone lines:
Zone Line |
Description |
|---|---|
HOP |
the Harmonic Optimized Price (HOP) [See Video on HOP] |
T1 |
first price target calculated based on the exact ratios of the pattern. |
T2 |
second price target calculated based on the exact ratios of the pattern. |
XA |
for M/W patterns, the XA ratio that defines the pattern. |
AB=CD |
the minimum AB=CD extension that precedes the XA. |
BC |
the minimum BC extension that precedes the XA. |
Here are some examples of the zone lines displayed for various patterns:
ABCD Pattern |
|
Bat Pattern
|
|
Butterfly Pattern |
|
Gartley Pattern |
|
Crab Pattern |
|
Shark Pattern |
|
For the 5-0 pattern we display the following zone lines:
At the price level defined by the 0.500 BC retracement
At the price level that would create a AB=CD leg length match.
The Stop is also displayed based on the actual pattern ratios. The 5-0 pattern does not have defined targets so none are displayed. |
|
Potential patterns follow the guidelines listed above for Confirmed/Pending patterns but we omit the target and stop levels.
|
See Also:
