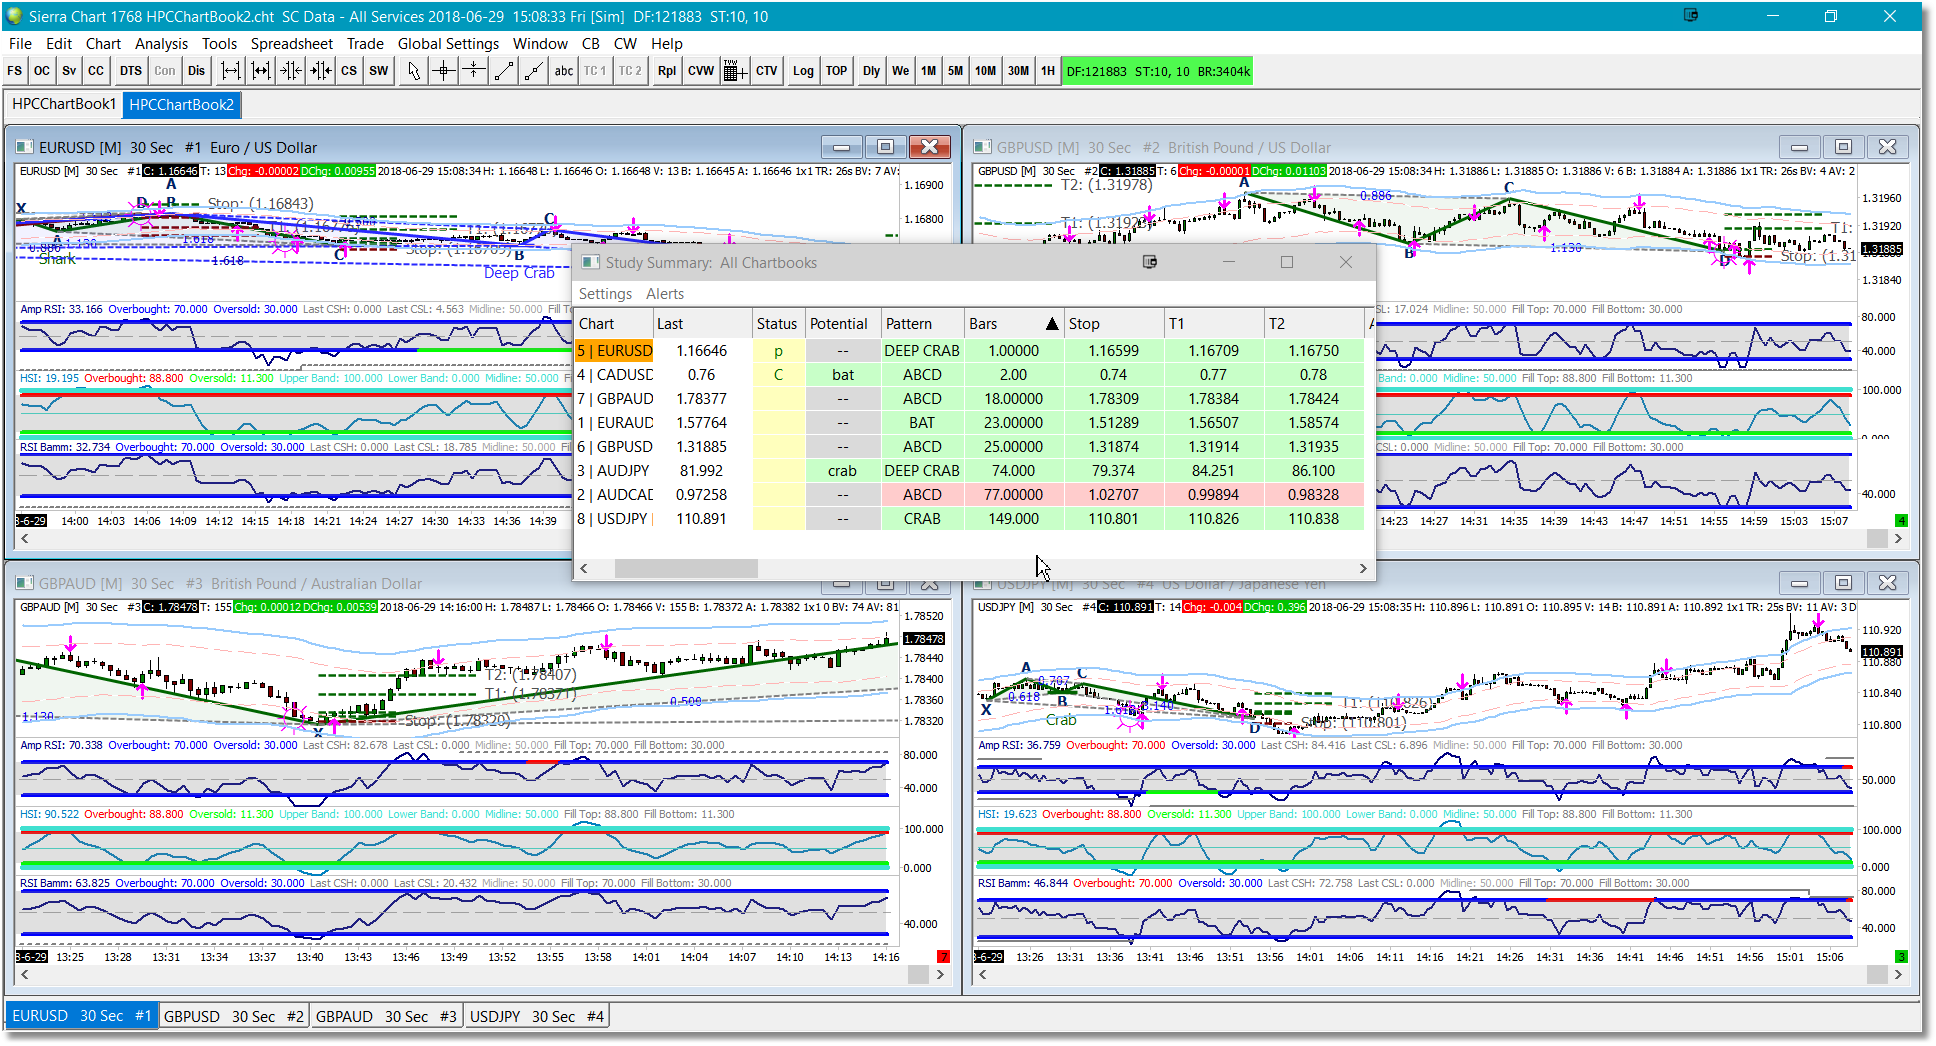
Sierra Chart does not have true watchlist/market analyzer functionality such as we have in the eSignal and NinjaTrader platforms. However it does have the Study Summary feature which does provide an effective summary of pattern activity for all of the charts in all of your currently open ChartBooks.
For information on how to set up your ChartBooks and initialize the Study Summary dialog, please refer to our Quick Start section.
The Harmonic Patterns Indicator will display 7 columns that appear within the Study Summary dialog:
Column |
Description |
Status |
This column is used to highlight any alert conditions. The scanner component will track Pending pattern alerts as well as Confirmed pattern alerts. When a Pending pattern alert is triggered for a particular security a lowercase 'p' will be displayed in the Status column. When a Confirmed pattern alert is triggered a uppercase 'C' will be displayed.
|
Potential |
This column will display the name and indicate the direction of any Potential patterns that may be forming in the security being monitored. If a Potential pattern is present the pattern name, in lowercase, will be displayed in this column and the color will indicate pattern direction.
|
Pattern |
This column will always display the most recent Pending or Confirmed pattern. The pattern name, in uppercase, will be displayed and the color will indicate pattern direction.
|
Bars |
This column displays the age, in bars, of the most recent Pending or Confirmed pattern. A Bars value of 0 or 1 means that the pattern is completing as of the current price bar and, in this case, it is considered a Pending pattern. A Bars value greater than 1 indicates a Confirmed pattern and represents the distance back to the last point of the pattern.
The Bars column is typically used as the primary sort so that more recent patterns are displayed at the top of the scanner window. From a trading standpoint you can safely ignore any patterns that are more than a few bars old.
|
HOP |
This column displays the Harmonic Optimized Price (HOP) value for the Pending/Confirmed pattern displayed in the Pattern column, if any.
|
T1 |
This column displays the first price target for the Pending/Confirmed pattern displayed in the Pattern column, if any.
|
T2 |
This column displays the second price target for the Pending/Confirmed pattern displayed in the Pattern column, if any.
|
You can sort on any of the columns listed above by clicking on the header row. The most logical column on which to sort would be the Bars column since that will keep the most recent patterns at the very top of the Study Summary list. When you click on any row in the Study Summary, Sierra Chart will automatically switch to the correct ChartBook page and will highlight the chart tab.
See Also:

