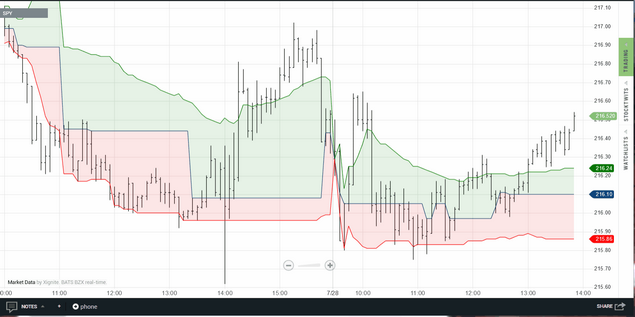
The POC/Value Area indicator is intended for intraday Technician charts only. Throughout the day it will incrementally calculate the POC (Point of Control) as well as the Value Area and will reset its calculations on each new day.
The POC is the price level at which the most volume occurred. If there is more than one price level with the same max volume, the price level closest to the mean of the range is used as the POC.
The Value Area is calculated using the standard percentage method. The percentage method accumulates volume on either side of the POC until the user-specified percentage of the total profile volume is reached. So using 70% as the percentage, the Upper Value Area and Lower Value Area will bound 70% of the volume traded in the data range.
POC/Value Area displayed on a 5-min SPY chart using a 70% value area percentage.
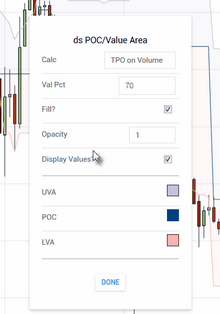
You can select to calculate the POC/Value Area based on volume (i.e., in the same fashion as Volume Profile) or based on price (i.e., similar to Market Profile) and you can specify the percentage to be used in the Value Area calculation.
One interesting application for Value Area is what is known as the 80% rule. This states that if a security opens below the prior day's Lower Value Area, or opens above the prior day's Upper Value Area, and if price then enters the prior day's Value Area and remains inside of the prior day's Value Area for at least 2 consecutive 30-min periods, there is an 80% chance that price will fill the prior day's Value Area.
|
Note: This indicator will operate on intraday intervals only. |
The POC/Value Area indicator has a number of parameters that can be adjusted, which you can access via the parameters dialog once the indicator has been loaded. See the Settings section for a complete description of all of the available parameters.
Make your settings changes and then click on
the Done button to apply them to the overlay
See Also:


