The MESA Cycles indicator is the companion to the MESA Spectrum indicator and it uses the same Maximum Entropy Spectrum Estimation logic to perform the cycle analysis. While the MESA Spectrum indicator produces a power spectrum from the cycle data, the MESA Cycles indicator will plot the actual cycles in the correct phase and relative amplitude and it will extend those cycles a user-defined number of bars into the future. The cycles are ranked by strength and up to 6 cycles can be plotted. The MESA Cycles indicator will operate on all bar intervals available in Technician.
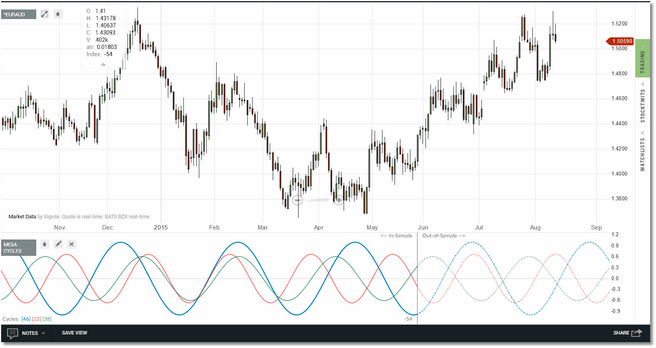
The top 3 cycles plotting in a EURAUD chart using an offset of 54 bars. The actual cycles being plotted are listed at the bottom left of
the indicator panel, color coded to match the cycle plot color. The current offset is clearly marked with a vertical grey line.
Notice that in the image above that there is grey vertical line in the indicator pane at the end of May. This is the current offset for the indicator. In this particular case we selected an offset of 54 bars and we are using a window size of 512 bars. So the 512 bars of price data to the left of that vertical grey line were used to perform the cycle analysis, and the indicator knows nothing about the price data that is to the right of the vertical grey line. We refer to these sections in the indicator pane as "In-Sample" and "Out-of-Sample" respectively. As mentioned above, up to 6 cycles can be displayed and the strongest cycle is always plotted using a slightly thicker line. The "In-Sample" plot type is always a solid line while the "Out-of-Sample" plot type is always a dashed line.
|
Note: At times you might see the following message in the MESA Cycles indicator pane: "Not enough quotes to compute MESA Cycles". This simply means that there are currently not enough bars of data loaded into the chart to calculate the cycles, based on the Window size you have selected. The solution is to use your mouse and drag the chart to the right, which will force more bars to be downloaded and displayed in the chart. Once enough bars are present in the chart the calculation will complete. |
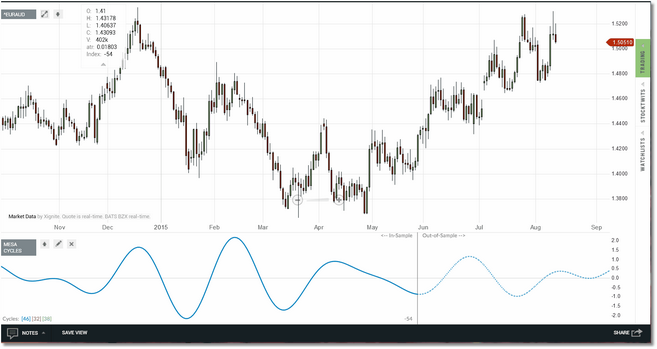
In addition to plotting the individual cycles, the MESA Cycles indicator can also create a composite of the selected cycles as a single plot if you prefer. So in this scenario we are performing the cycle analysis, filtering out the noise and extracting the top X cycles (where X is from 1 to 6) and then recombining those cycles in the correct phase to create a proxy for the price action based solely on the extracted cycles.
The same top 3 cycles as in the first image above but combined to create a single projection. The actual cycles used to create
the composite are listed at the bottom left of the indicator panel.
When the MESA Cycles indicator is first loaded it will have an offset of 0, meaning that the data window includes the current price bar. Now while you can certainly use the indicator with a 0 offset, the preferred approach (as in our examples above) is to set the offset back to a recent swing high or swing low in the price data (actually a couple of bars past the actual swing). This gives you the ability to see how well the cycle projection fit the price action that occurred between the offset and the most current price bar (i.e., the out-of-sample period) since we are not just looking for cycles, but for cycles that are likely to continue to reflect in the price action into the future. Remember, the indicator knows nothing about any price data that is to the right of the vertical grey line so we can use this out-of-sample period to determine if the price action continues to track the cycles (or not). An even better approach is to take a bit of time and test using different offsets (i.e., pick the 4 or 5 most recent swings in the price data and set the offset just past each of these swings and then analyze the out-of-sample period). Pick the offset that produces the best out-of-sample performance and leave it there. When a new swing high or swing low forms in the price data, repeat the process to find the current "best" offset to use. There will be times when, regardless of which offset you choose, the out-of-sample performance of the cycles will just not match the price action at all. The key here is, don't force it...if you cannot find any clear cycles in the out-of-sample period then just step aside.
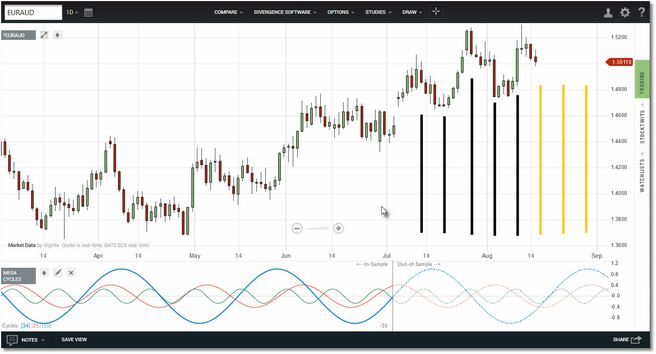
Above is an example of validating cycles using the out-of-sample period. The offset was set just past a recent swing low in July. In the
out-of-sample period we can see that the 10-period cycle (in green) matches the price action very well. The black lines show where
the price action swing highs/lows matched the peaks/troughs of the projected cycle. The orange lines show where we would expect
swings to occur in the near future since, until proven otherwise, we can expect the 10-period cycle to be in play. Again, just an example
but the same logic can be applied regardless of the cycle length, and often you will find that more than one cycle tracks well with the
out-of-sample price data.
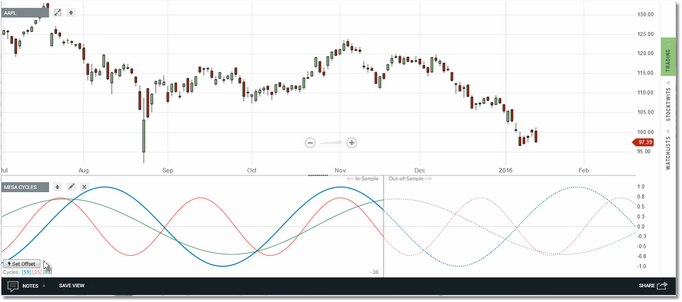
New! As of 01/16/2016 we have put in place a new version of MESA Cycles that has a Set Offset button integrated into the panel.
To set the offset simply click on the button, then move your cursor to the location in the panel where you would like the new offset, and then left-click your mouse. The new offset will be drawn and the indicator will recalculate based on the new location. You can still use the old method for setting the offset if you prefer, but the button makes it much faster and easier to accomplish.
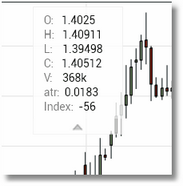
To aid you in determining the exact bar offset we have added an "Index" item to the Technician HeadsUp display widget that appears whenever the MESA Cycles indicator is loaded. When you move the crosshairs around the chart, the Index will display how many bars back the crosshairs are from the most recent price bar. Just use this number when setting the offset in the MESA Cycles parameters menu (or just use the new Set Offset button as discussed above).
The HeadsUp display. The Index
item shows the bars back from the
crosshairs to the most recent price
bar. So in this example our cross-
hairs are 56 bars back from the
most recent price bar.
Using cycles is as much an art as it is a science since, even if a large window size is selected (i.e., 1024), the cycle composition will change slightly on each new bar. The approach outlined above (i.e., setting the offset a few bars past a recent swing high or swing low and then analyzing the cycle performance in the out-of-sample period) gives you at least some confirmation that the selected cycles will continue to reflect in the price action for some number of price bars to come. However there are other uses for cycles, such as risk management. For example, if you have recently entered a long position, and if one or more of the strongest cycles have bottomed out and are starting to turn up, you can perhaps use a wider stop to give the trade room to grow. And when the cycles top out and begin to turn down, you can tighten the stop to protect profits.
|
This indicator is very calculation-intensive and its use is not recommended if you are accessing Technician from a mobile device (i.e., Android or IOS). |
See Also:
