For those of you that also subscribe to the Harmonic Pattern Collection, you will find that the MESA Cycles indicator is also a very useful pattern confirmation tool. The implementation is simple:
•Anchor the MESA Cycles indicator on one of the pattern legs (for short to medium patterns generally the first leg, for longer patterns the 2nd or 3rd leg);
•Look for a cycle (or cycles) that correspond(s) with the overall structure of the pattern.
•Compare the cycle projection with the projected completion point for the pattern.
Here are a couple of examples using already-completed (Confirmed) patterns to illustrate the process. Obviously in actual operation you would typically use the MESA Cycles indicator in conjunction with Pending or Potential patterns rather than Confirmed patterns (click on the images to enlarge):
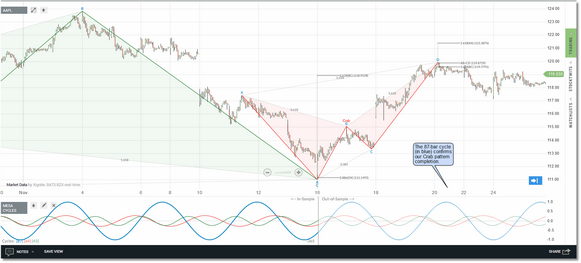
In the AAPL (Apple) chart above we are looking at the bearish Crab pattern. We anchored the MESA Cycles indicator on the 2nd leg of the pattern (the A point) and inspected the projected cycles with regard to the D point of the Crab pattern. You can see that the 87-bar cycle (in blue) most closely matches the structure of the pattern and, based on the projection, a turn down in price is expected in the vicinity of the Crab D point, which is in fact what happened.
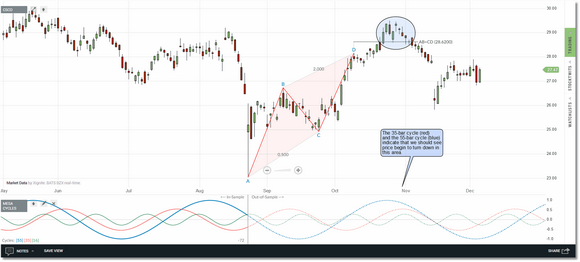
In this next CSCO (Cisco) chart above we are looking at a bearish AB=CD pattern. We anchored the MESA Cycles indicator on the A point of the pattern and inspected the cycles. A combination of the 35-bar cycle (in red) and the 55-bar cycle (in blue) most closely match the structure of the pattern and, based on the cycle projections, they indicate that the change in direction will occur several bars after the end of the AB=CD pattern which, again, was the case.
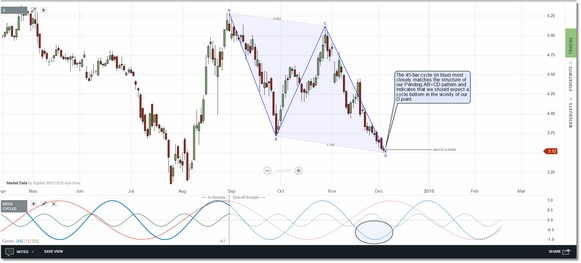
In the S (Sprint) chart above we are looking at a Pending bullish AB=CD pattern. Pending simply means that this pattern has completed its ratio and filter requirements as of the current bar. It is not yet a Confirmed pattern because the final price pivot has not completed and, for example, if price continues to drop then this particular AB=CD pattern may be invalidated. This is how you would typically use the MESA Cycles indicator (i.e., to confirm Pending or Potential patterns). So in this case we anchor the MESA Cycles indicator on the A point of the pattern and inspect the cycles. The 45-bar cycle (in blue) most closely matches the structure of the pattern and the projection does indicate that we should expect a cycle bottom on or about the current price bar. However the larger 71-bar cycle (in red) is just coming off a cycle top so caution would be advised (i.e., wait for the pattern to Confirm before taking a position). Again, based on the cycle projection, the real push upwards may not occur until early to mid February.
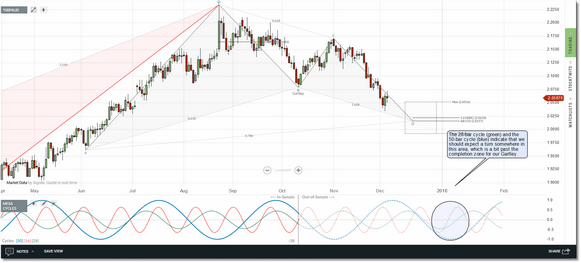
In this final example we are looking at a Potential bullish Gartley pattern. This is a longer pattern and we chose to anchor on the B point rather than the X or A points so we would be using more recent price data for the cycle analysis. The closest match to the pattern structure would be the 28-bar cycle (in green), and that cycle in conjunction with the 50-bar cycle (in blue) would indicate that our true cycle bottom will occur a few bars past the completion zone specified for this Gartley. Probably a good idea to continue to monitor the pattern as it nears the completion zone (and perhaps do a cycle check from the X point and the A point, as well as the B point).
|
If you are not familiar with harmonic patterns and are a bit confused about the "bats" and "butterflies", don't worry. The patterns (and the names) are simply a method to identify and quantify specific price formations that are also comprised of specific fibonacci-based ratios as well as a time component. These patterns occur frequently across all securities and timeframes and are very often precursors to a change in trend. The principles behind harmonic patterns are not that different from Elliott Wave analysis, or even the simple measurement of retracements/extensions that traders often use. For more information please reference the Harmonic Pattern Collection user guide. |
See Also:


