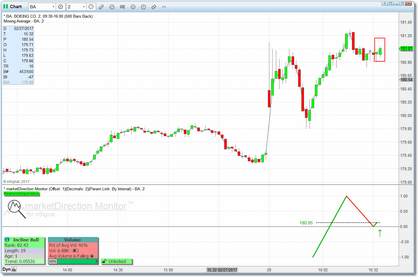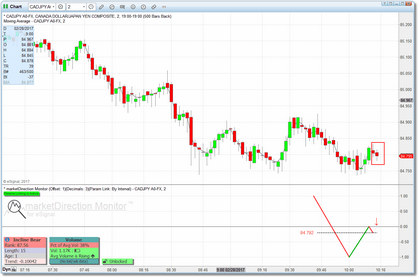
Incline
This is a very specific formation that has been isolated in its own category because of it's high frequency, especially in the currencies and on lower bar intervals in general. This formation represents a brief retracement/shakeout in a up or down trend and can be clearly seen over and over again if you browse through some 1-min to 15-min currency charts. In general, the stronger the trend, the more predictable the formation. But keep in mind that all trends do come to an end and an incline formation that breaks strongly in the opposite direction can be a good indication of a trend reversal.
This formation is generally only valid for one bar, although on occasion the "incline" will take longer to develop and the formation will either extend automatically or disappear for a few bars and trigger again. On currencies this is typically a fast-moving formation with a volatile reaction while on US securities it is usually slower to develop. By the time the Incline formation is identified by marketDirection Monitor, the brief retracement has already occurred and price has made the turn back in the original direction, with the assumption being that it will continue on its way. It is recommended that you keep the Maximum Age parameter for this formation at 5 or higher so you will have a second chance for those formations that do not react immediately.
In the examples above, the highlighted region (red rectangle) indicates the area in which we expect the reaction. If trend does continue in the original direction then the assumption is that price will at least reach the prior swing high or swing low. In situations where we have an extended Incline formation it will often turn into a Chevron formation as price nears the prior swing level. There are times where price will actually continue in the direction of the retracement, after a brief consolidation at the inflection point. While this can turn into an extended Incline formation, more often than not it indicates a change in the overall trend. Regardless how it unfolds you will generally have enough advance warning to plan accordingly.
|
Note: If you would like to actually see the inflection point zones drawn in the price pane as in our examples above, then see the Chart Zone Tool section. |
Alerts
Current (i.e., Age = 1) Incline formations, by default, will generate an alert condition whenever price moves past the prior bar's high (for a bullish Incline) or the prior bar's low (for a bearish Incline). Aged (i.e., Age > 1) Incline formations will generate an alert when price moves past the original alert condition high or low AND current bar has exceeded prior bar. So, for a bullish alert, price would have to be above the original alert level high and the current bar high must be above the prior bar high (reverse for bearish alert).
You can also use the two Alert Padding parameters to delay the alert condition until a more significant move has taken place. See the Alert Padding section for details.
This alert condition will show up immediately in the watchlist component (i.e., ♫ in the Status column). If pop-up and/or audible alerts are turned on then those will be generated as well. Email alerts are also available, but only in the chart component. See Settings for more information on the alert-related parameters.
|
Note: If a solid black circle (●) is displayed in the Status column in the watchlist along with the alert condition (♫) this indicates that price has both reached the inflection point is trading at volume that is above the average volume for the security. This might indicate that price is moving rapidly in the desired direction. |
Parameters
The parameters that can be adjusted for the Incline formation are:
•Minimum Rank for Display
•Maximum Age
•Alert Padding - Type
•Alert Padding - Factor
See the Settings section for more detail on these parameters.


