Dome & Chevron
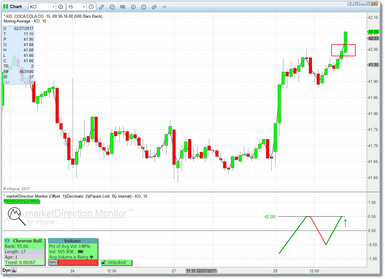
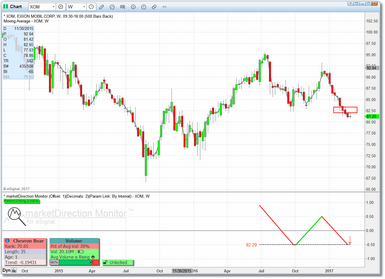
This category covers a range of formations that roughly take on a Dome or Chevron shape. The Chevron type of formation is typically the most dynamic and is seen across all time frames in the form of very directional swings generally comprised of higher-highs and higher-lows (although not a requirement), or vice-versa. marketDirection Monitor seeks out these formations specifically in situations where price is nearing the prior swing high or low. Price will either push through with force (if the up-trend or down-trend is destined to continue), or reverse, or possibly consolidate for a time before making a move.
In the examples above, the highlighted region (red rectangle) indicates the area in which we expect the reaction. In both of these examples price pushed through the inflection point in the direction of the bias. However, often times price will consolidate briefly before making a move and, no matter what the directional bias, be prepared for a reversal.
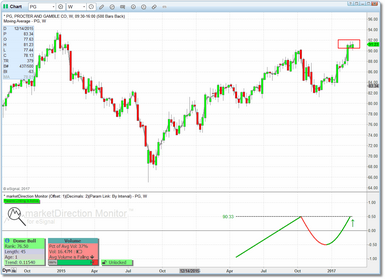
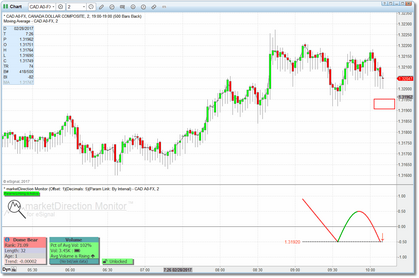
The Dome formation is a bit slower moving and is typically represented by price stalling out at a high, and then making a very gentle move back down on low volume and then a gentle move back up to the prior high (for a bullish formation). As with the Chevron formation, when price reaches that prior high something usually happens. Sometimes the Dome formation will push through with force (as with the Chevron formation) but often times there will be a brief retracement when the Dome formation reaches the prior high, and it will turn into the very well-known cup-and-handle formation. So if a Dome formation stalls, don't be surprised if it appears again several bars later.
Again, in the examples above the highlighted region indicates the area in which we expect the reaction. You will notice in the Dome Bear example that the formation was identified quite early and it will likely not reach the inflection point for 2 or 3 more bars.
|
Note: If you would like to actually see the inflection point zones drawn in the price pane as in our examples above, then see the Chart Zone Tool section. |
For Dome and Chevron formations the price level of the prior high or low is always displayed on the reference line. This is the price level at which we expect the reaction and should not be considered the entry point. Better to wait to see how the formation develops since with these formations you generally have time. Also, with the default settings marketDirection Monitor will identify some very small Dome and Chevron formations. If you prefer to focus on larger formations then change the Minimum Formation Width in the parameters menu to a larger value.
Often you will see a Dome or Chevron formation that is clearly a small part of a larger Dome or Chevron. If the smaller formation does not interest you it is likely that the larger formation will show up on the radar at some point.
Now not all Domes and Chevron's are created equal and, depending upon the rank assigned, some will take on shapes that are less than perfect. But the idea is that if these are clear enough to be visible to other traders then they will likely generate interest and be actionable. There will be times when a Dome will be identified that looks more like a Chevron, and vice-versa. Internally, though, the distinction is based not only on relative shape but also on anticipated volatility (i.e., a Chevron is typically destined to be more volatile than a Dome).
The basic assumption is that a bullish Dome or Chevron will push price up while a bearish formation will push price down but you should always be prepared to take advantage of a reaction in the opposite direction.
Alerts
Current (i.e., Age = 1) Dome and Chevron formations, by default, will generate an alert condition whenever price moves past the value displayed on the left-hand side of the reference line. Aged (i.e., Age > 1 ) Dome and Chevron formations will generate an alert condition when price moves past the original alert price level AND current bar has exceeded prior bar. So, for a bullish alert, price would have to be above the original alert price level and the current bar high must be above prior bar high (reverse for bearish alert).
You can also use the two Alert Padding parameters to delay the alert condition until a more significant move has taken place. See the Alert Padding section for details.
This alert condition will show up immediately in the watchlist component (i.e., ♫ in the Status column). If pop-up and/or audible alerts are turned on then those will be generated as well. Email alerts are also available, but only in the chart component. See Settings for more information on the alert-related parameters.
|
Note: If a solid black circle (●) is displayed in the Status column in the watchlist along with the alert condition (♫) this indicates that price has both reached the inflection point is trading at volume that is above the average volume for the security. This might indicate that price is moving rapidly in the desired direction. |
Parameters
The parameters that can be adjusted for Dome and Chevron formations are:
•Minimum Rank for Display
•Maximum Age
•Minimum Proximity
•Minimum Formation Width
•Minimum 'Retrace" Depth
•Unbroken Formations Only
•Alert Padding - Type
•Alert Padding - Factor
|
Note: If you feel that some of the Dome and Chevron formations being displayed are too small then you should increase the values in the Minimum Formation Width and/or Minimum 'Retrace' Depth parameters. |
See the Settings section for more detail on these parameters.


