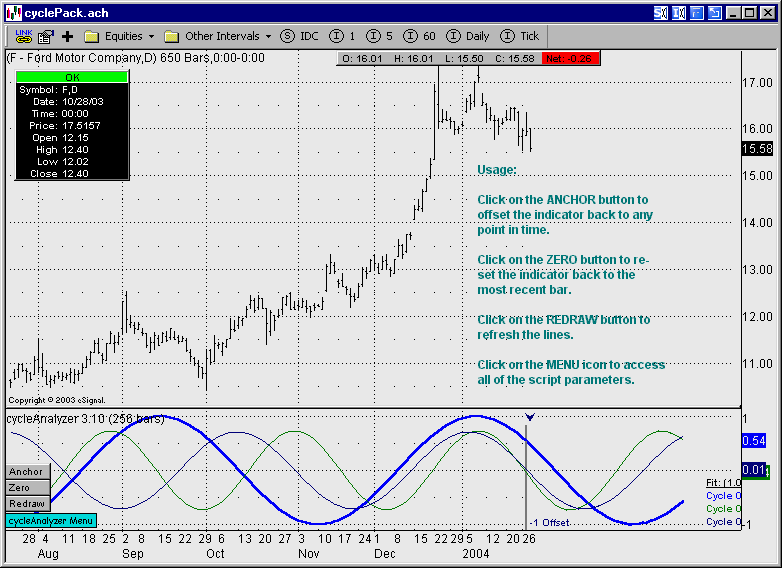
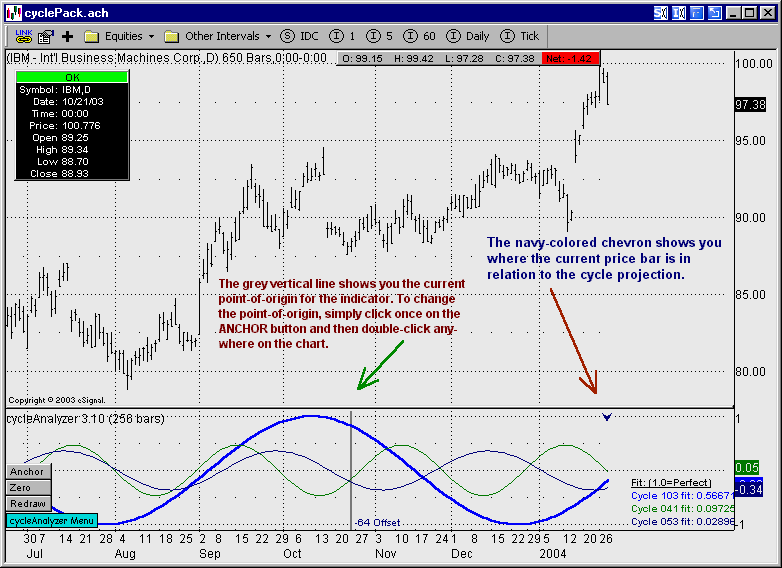
Chart Controls & Usage

In the cycleAnalyzer, cycleProjector and cycleProjectorXT indicators, there are 3 buttons and a menu icon that are available for making quick adjustments:
| • | Anchor - This button is used to change the point-of-origin of the indicator. The point-of-origin is always highlighted by a vertical grey bar. Single-click on the Anchor button (it will turn white to acknowledge the click) and then double-click anywhere on the chart. The indicator's point-of-origin will be moved to this new location and the cycle analysis will be performed. Remember that the indicator has no knowledge of any data that is to the right of the point-of-origin. |
| • | Zero - This button is used to reset the point-of-origin to the most current bar on the chart you are viewing. Just click on the Zero button once and the point-of-origin will immediately move to offset 0 on your chart. |
| • | Redraw - This button simply redraws the lines in the indicator pane. On occasion, when you quickly switch from symbol to symbol, the cycleAnalyzer or cycleProjector indicator pane may appear blank. If this happens, just click on the Redraw button and all lines and text will be displayed. |
| • | Menu - This icon provides quick access to the script parameters. Just click once on this icon and the script parameter menu will be displayed. |

Using cycleAnalyzer
w Experiment with the number of cycles displayed. The default is 3 but in some situations you may gain a better picture by displaying 4 or 5.
w Look for a cycle (or cycles) that track well with recent price action and have a fitness value of 0.20 or greater.
w Cycles will sometimes change significantly from bar-to-bar and this can be disconcerting. One valid approach is to try re-anchoring the study at different locations between 0 and 20 bars back from the current price. If you find an anchor point that results in at least one reasonably well-correlated cycle (that also tracks well with price action between the anchor point and the current price) then stick with this projection and use it until its accuracy degrades. Another effective method that we have found is to anchor the cycleAnalyzer indicator 3 or 4 bars past the most recent well-defined swing low or swing high displayed on your chart. Typically, once you load a chart you will be able to identify a clear swing high or swing low somewhere within the most recent 100 bars of price data. Anchor the cycleAnalyzer indicator a few bars past the actual top (for a swing high) or bottom (for a swing low). Use this anchor point until a new well-defined swing high or swing low is formed and then re-anchor the indicator. The bottom line is don't be afraid to try different anchor points as you can always go back to a previous anchor that was working well for you.
w Use the projected cycles to determine approximate times for cycle highs or lows. Use these in conjunction with other support/resistance tools (e.g., floor trader pivots, trend lines, etc.) or oscillators.
w cycleAnalyzer is ideally suited to short-term traders and daytraders. It provides critical price action information without being too distracting. In addition, overall CPU consumption is very reasonable which can be important to fast-paced traders with many active charts.
Using cycleProjector/cycleProjectorXT
w Experiment with the standard and XT version to determine which one best meets your requirements.
w Use the Fitness (Fit:) and Pivot Point (PP:) legends to get an idea for how well the back-plot matches the historical data. Look for a fitness value above 0.40 and a Pivot Point score above 50%. A strong Pivot Point score (e.g., 80% or above) is generally acceptable in lieu of a strong fitness value.
w A good cycleAnalyzer anchor point is usually the best anchor for the cycleProjector indicator as well. Follow the instructions for anchoring the cycleAnalyzer above. When you find a good point, move the cycleProjector indicator to this location.
w When utilizing the projection in your trading, focus more on the near-term projected turning points and less on the amplitude or overall shape of the projection.
w Use the projections in conjunction with your other technical analysis tools to isolate specific turning points (or cycle tops or bottoms) of interest. Remember, these are not predictions. Rather, the projections are showing you how the security you are charting is likely to behave if the forces moving the security now continue into the future.
w Anchoring the indicator a few bars back from the current bar is a good way to determine if the projection has validity. The closer the projection matches up with the first 5 to 20 bars of data, the better.
Copyright © 2010-2013 Divergence Software, Inc.