cycleProjector

As the name suggests, the cycleProjector indicator projects future price action based upon the cycles that are present in the existing price data. cycleProjector takes a snapshot of the price action at a user-selected point in time (generally the most recent price) and, through a variety of filtering and spectrum analysis techniques, determines all of the cycles present in the price data. After evaluating each cycle to determine consistency, phase and amplitude the cycleProjector indicator creates a synthetic time series based solely on the cyclical content and projects this synthetic times series both backwards and forward in time. The 'fit' of the historical synthetic time series back-plot is used to determine how comfortable you are with the synthetic time series projection that extends into the future.
Just as with the cycleAnalyzer indicator, you have a high degree of control over which existing cycles are used to create the projection and you can easily offset the study back in time to get a feel for how accurate the projections have been on a historical basis.
Usage
The strength of cycleProjector lies is its ability to highlight likely future turning points in the security you are charting. The cycleProjector indicator can be used standalone or, better yet, in conjunction with the cycleAnalyzer indicator. If you experiment with the indicator you will quickly find that the projections based on the synthetic time series are often very accurate in the short-term and, at times, even the long-term. The key is learning how to use cycleAnalyzer and cycleProjector indicators together so that you can ignore the weak projections and focus on the strong ones. The best projections tend to be those that contain at least a few individual cycles that are well-correlated with the current price data and you can use the cycleAnalyzer indicator to help you determine if that is the case.
When comparing the synthetic time series created by cycleProjector to the actual price data, it is important to understand that the synthetic time series contains no long-term trend (the trend is removed as part of the cycle analysis process). This means, for example, that it cannot tell you if a particular security is likely to trend higher or lower over a specific period of time. What it can do, however, is identify the likely future turning points and give you some idea as to the magnitude of those expected turns and swings.
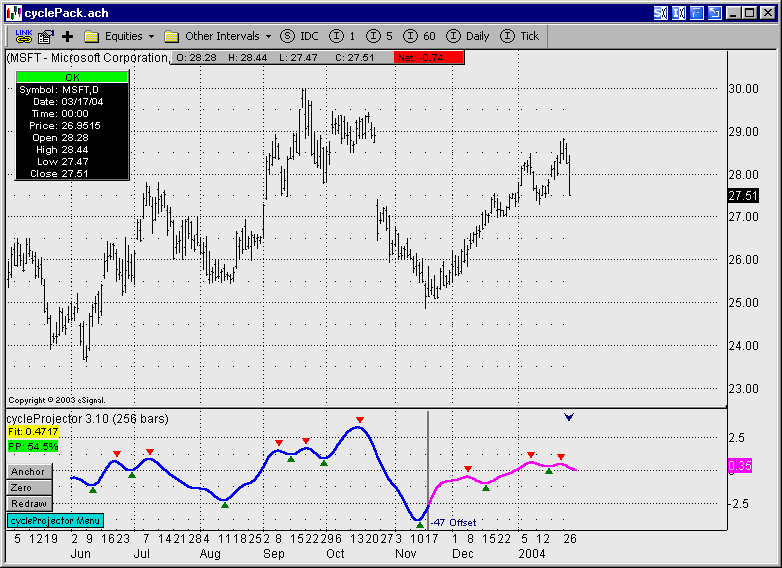
In the MSFT example chart above we anchored the cycleProjector indicator on the 11/17/2003 price bar and we set the Data Window size to 256. This means that only the 256 price bars up to and including the 11/17/2003 bar were used in the cycle analysis. As far as the cycleProjector indicator is concerned, the price data after 11/17/2003 does not exist. Many distinct cycles were uncovered in the price data and, for this example, we elected to combine only the 10 strongest cycles to create our synthetic time series. If you look at the back-plot (blue line) as well as the projection (magenta line), you can see that the indicator did a very respectable job of projecting the overall direction as well as the major turning points, and it correctly identified the 11/17/2003 time frame as a major cyclical bottom.
Operational Highlights
cycleProjector works on all time frames from 1-minute bars to monthly bars. (Note: it will function correctly with Tick data but the value of cycle analysis at that level is questionable).
cycleProjector takes a snapshot of the data at a particular point in time, creates a synthetic time series based solely upon the cyclical content, and projects this synthetic time series both backwards AND forward in time. The synthetic time series display will remain fixed until either the Anchor or Zero button is clicked.
cycleProjector ignores the long-term trend and instead focuses on projecting future turning points.
cycleProjector can be offset back to any point in time. This feature enables you to visually backtest the indicator to get a feel for how accurate the projections are likely to be for the security and bar interval you are trading.
cycleProjector can be configured to use data from a higher time frame for the cycle analysis. The results of this analysis will then be extrapolated back into the viewing time frame.
cycleProjector has three sorting options available that allow you to create cycle projections based on a variety of configurations. You can sort by Persistency (most persistent to least persistent or vice versa), Strength (strongest cycle to weakest cycle or vice versa) or by Length (longest cycle to shortest cycle or vice versa). You can also adjust the total number of cycles to be used in creating the synthetic time series.
cycleProjector offers flexibility in terms of its application. It can be applied to the actual price data or it can be applied to a user-defined moving average of the price data.
Copyright © 2010-2013 Divergence Software, Inc.