Market Analyzer Operation
Using the Harmonic Patterns Indicator in the NinjaTrader Market Analyzer is simply a matter of selecting one of the pre-defined market analyzer templates. We have provided templates for 1-min, 5-min, 15-min, 30-min, 60-min, 120-min, 240-min, and Daily bar intervals. You can use these templates as-is, or you can modify them to suit your needs.
|
The Market Analyzer component has a tabbed interface. Using the tabs you can create multiple lists to be monitored in realtime, one list in each tab. You can also link each tab in the Market Analyzer to a specific chart via "linking". Refer to the NinjaTrader user guide for more information on linking (we also provide a short linking tutorial below)..
|
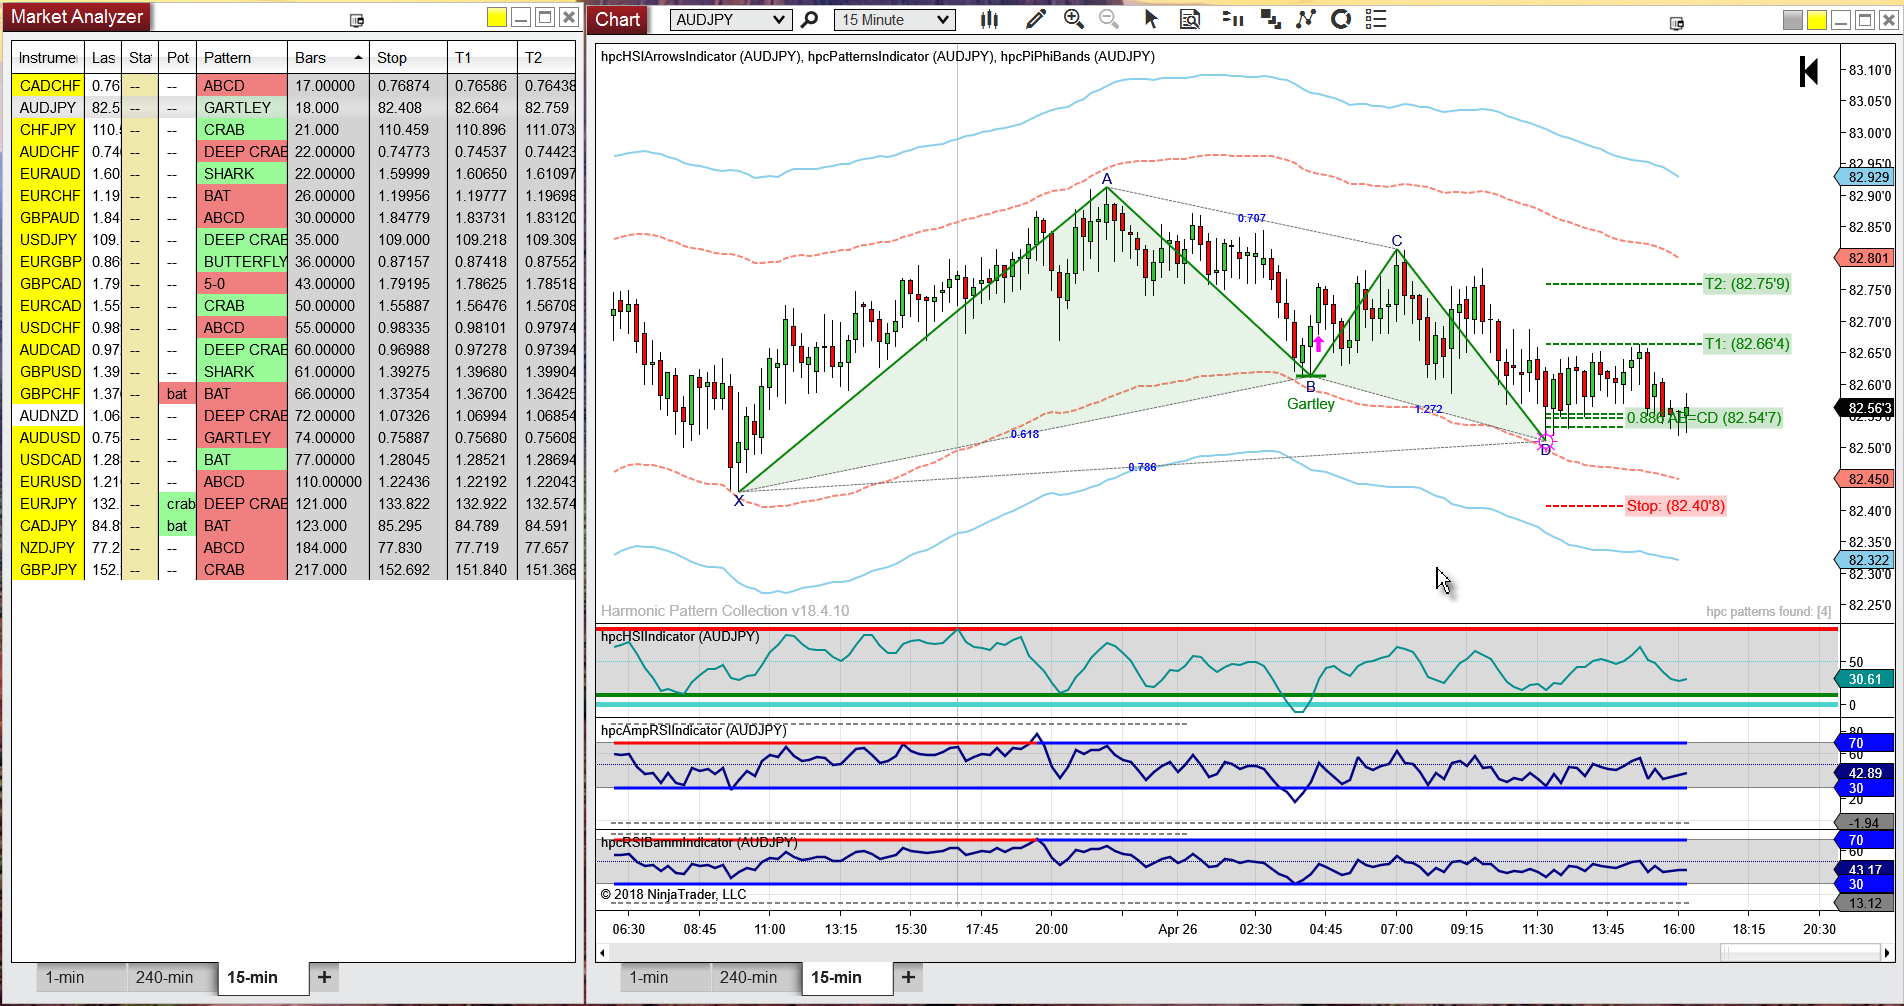
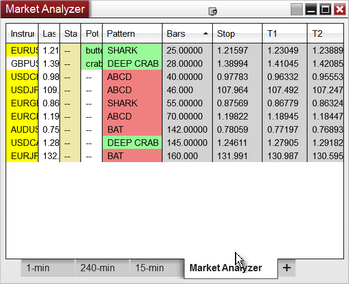
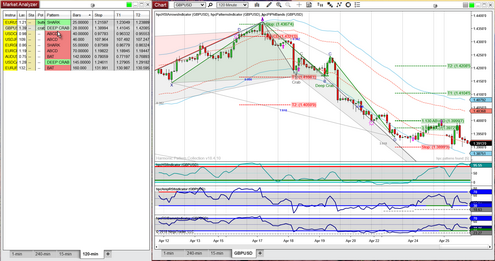
The Harmonic Patterns Indicator recognizes when it has been loaded into the Market Analyzer (MA) instead of a chart, and adjusts it's behavior accordingly. When run in the MA the indicator will display 7 columns:
Column |
Description |
Status |
This column is used to highlight any alert conditions. The Market Analyzer component will track Pending pattern alerts as well as Confirmed pattern alerts. When a Pending pattern alert is triggered for a particular security a lowercase 'p' will be displayed in the Status column. When a Confirmed pattern alert is triggered a uppercase 'C' will be displayed.
|
Potential |
This column will display the name and indicate the direction of any Potential patterns that may be forming in the security being monitored. If a Potential pattern is present the pattern name, in lowercase, will be displayed in this column and the color will indicate pattern direction.
|
Pattern |
This column will always display the most recent Pending or Confirmed pattern. The pattern name, in uppercase, will be displayed and the color will indicate pattern direction.
|
Bars |
This column displays the age, in bars, of the most recent Pending or Confirmed pattern. A Bars value of 0 or 1 means that the pattern is completing as of the current price bar and, in this case, it is considered a Pending pattern. A Bars value greater than 1 indicates a Confirmed pattern and represents the distance back to the last point of the pattern. If there are no Confirmed or Pending patterns present for a particular security then a grey background is used and a dashed line is displayed.
The Bars column is typically used as the primary sort so that more recent patterns are displayed at the top of the MA.
|
HOP |
This column displays the HOP (Harmonic Optimized Price) value for the Pending/Confirmed pattern displayed in the Pattern column, if any.
|
T1 |
This column displays the first price target for the Pending/Confirmed pattern displayed in the Pattern column, if any.
|
T2 |
This column displays the second price target for the Pending/Confirmed pattern displayed in the Pattern column, if any.
|
|
Note: The copy of the harmonic patterns indicator running in the Market Analyzer will update on a regular basis as per the Update Type and Update Interval values you have specified in the parameters menu. By default, the Market Analyzer will update every 20 seconds intrabar. It is possible that when you click on a row in the Market Analyzer the chart may not reflect exactly the same information. This is because the chart is updated to the current tick when it is loaded, but the harmonic patterns indicator running in the Market Analyzer may be up to 20 seconds behind. So, for example, the Market Analyzer may report a potential Bat pattern for a particular instrument, but when you click on that row you see no potential Bat in the chart. This is because the situation has changed since the last time the Market Analyzer updated (i.e., which may have been up to 20 seconds ago). If you wait a few seconds you will see that, in this case, the potential Bat will disappear from the MA display.
|
To load one of the pre-configured Harmonic Patterns Indicator Market Analyzer templates:
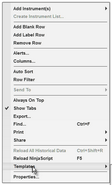
•Right-click anywhere in the Market Analyzer tabbed page and select the Templates option from the menu. A small sub-menu will appear, select the Load option from that menu.
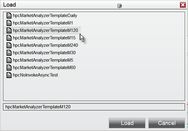
•The Load dialog will be displayed. Select the template you wish to load from the list (click on it) and then click on the Load button.
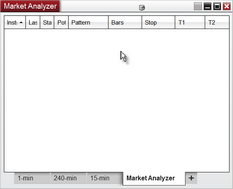
•The Market Analyzer window will now change to reflect the columns defined in the template you loaded.
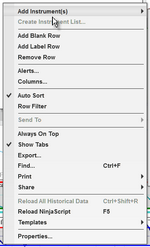
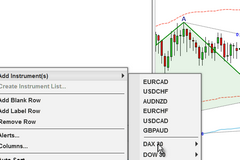
•To load your list of symbols, right-click anywhere inside of the Market Analyzer page and select the Add Instruments option.
•Another menu will appear to the right where you can select from individual instruments or pre-defined instrument lists.
•Select the instrument (or instruments) you wish to load and they will be pulled into the Market Analyzer tabbed page.
•Now is a good time to rename the tab in the Market Analyzer that houses your list. Just right-click in the tab itself and choose the Rename option from the menu. You can also click on any of the columns to implement your sort. We recommend sorting on the Bars column so that the most recent patterns will always be displayed at the top of the list.
Chart Linking
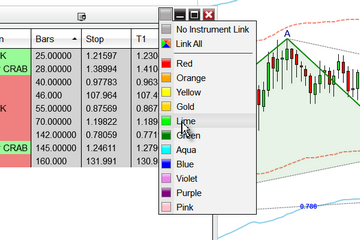
•To set up linking between your Market Analyzer tabbed page and a chart, left-click on the grey button that you see near the top-right of your Market Analyzer page. A menu will appear with a list of available colors. Select one of the colors from the list and the grey button will change to that color.
•Now, pull up a chart and perform exactly the same steps to select the same linking color in the chart. Note that in a chart there are actually two grey buttons...first one is for interval linking while the second one is for instrument linking, so be sure to select the 2nd button (the one closest to the right edge of the chart).
•When you are done, it should look something like this. The page in the Market Analyzer shares the same linking color as the tabbed page in the chart. Whenever you click on a row in the Market Analyzer that information will be displayed in the chart.
•You can set up multiple tabbed pages in this fashion, each page in your MA either holding a different list of instruments OR the same set of instruments in a different bar interval.
If screen real estate is tight, you can remove any of the columns that you don't feel you need.
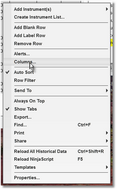
•Just right-click anywhere in the MA, select the Columns option from the menu.
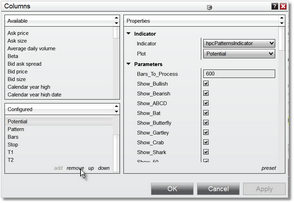
•Use the 'remove' option in the Columns dialog to remove any of the columns listed in the Configured section that you do not wish to display. Be sure to click on the OK button when done.
If the templates we have provided do not meet your specific requirements, you can easily modify them and save them under a new name. If you do modify a template, be sure to save it under a new name. If you do not do this then the original template will be loaded when you pull up the Market Analyzer.
|
Note: The Market Analyzer is a very useful feature but maintaining a large number of symbols can consume a lot of system resources. We currently limit the total number of symbols that can be loaded to 700.
|
See Also:

