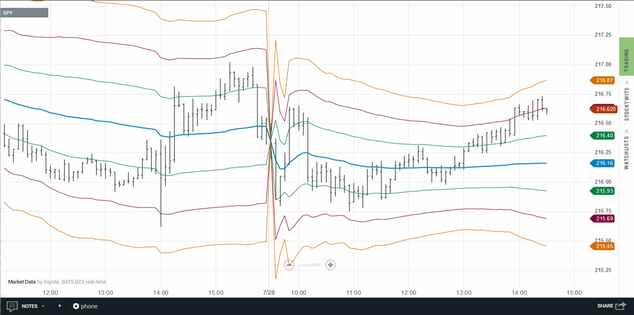
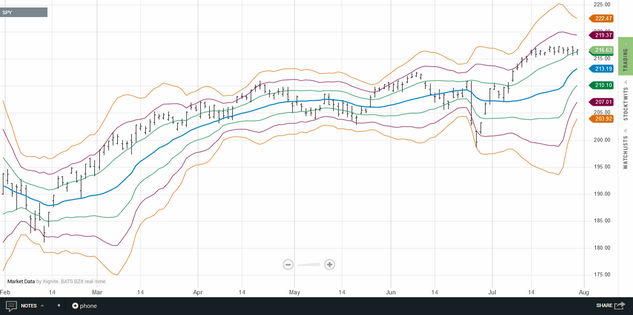
The VWAP indicator (Volume Weighted Average Price) will operate on any bar interval available in Technician. It will calculate and plot the VWAP line (using a Time Weighted Average Price algorithm) as well as up to three user-defined Standard Deviation bands. When used with an intraday chart, the VWAP calculation is cumulative throughout the day and will automatically reset on each new day. When used with Daily, Weekly, or Monthly charts, the VWAP and Standard Deviation plots will be based on a rolling lookback period that you define (default is 20 bars).
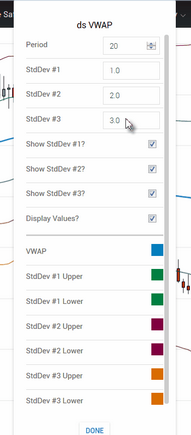
The VWAP indicator has a number of parameters that can be adjusted, which you can access via the parameters dialog once the indicator has been loaded. See the Settings section for a complete description of all of the available parameters.
Make your settings changes and then click on
the Done button to apply them to the overlay
See Also:


