Swing Pivots is a price swing measurement tool that is implemented as an overlay in Technician. It is similar in many ways to the popular ZigZag indicator with some useful features added.
|
The formula in this indicator assumes fixed bar widths when performing its calculations. Because of this it will not plot correctly if used in a Volume Candle (a relatively new chart type in Technician that plots the candles in various widths depending upon the volume associated with that candle.) chart. |
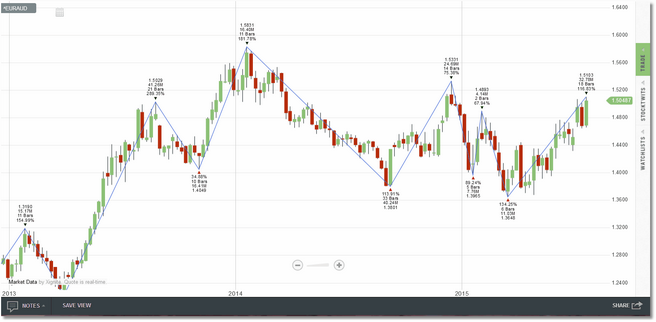
Swing Pivots running on a weekly EURAUD chart.
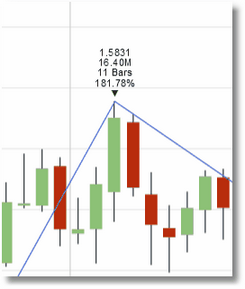
With Swing Pivots you can define swings using a minimum percent move or a minimum point move. It also has an ATR Multiple option (the default mode of operation) which automatically calculates the correct swing size for the security and bar interval that you are using based upon current volatility, which makes the indicator very flexible. In this mode you can fine-tune the swings by adjusting the ATR Multiple value (the default is 2.5 ATRs). For each swing, additional information is provided:
•Price: The price value of the swing high or swing low.
•Volume: The total volume accumulated during the swing move.
•Bars: The number of price bars that comprise the swing.
•Retracement: The percent retracement of the swing relative to the prior swing. |
Swing Pivots will run on any bar interval/custom period available in Technician.
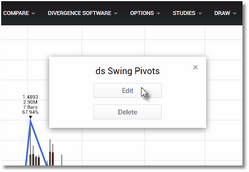
To remove the indicator from the chart, or to edit any of the settings, move your cursor over the plotted swing line. A small dialog will appear indicating that you should right-click to manage. Right-click in your chart and the Edit/Delete dialog will now be displayed:
Click Edit to access the parameter menu or
click Delete to remove the overlay.
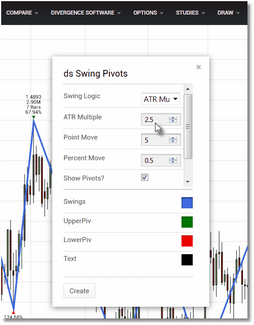
Click on the Edit button and the Swing Pivots parameters dialog will be displayed. See the Settings section for a complete description of all of the available parameters.
Make your settings changes and then click on
the Create button to apply them to the overlay.
See Also:


