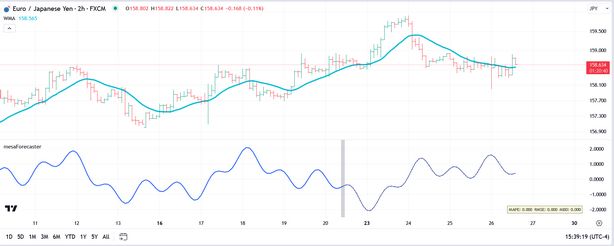
Tucked near the bottom of the indicator menu you will find several options related to Sine Wave testing. If you check the Do Sine Wave Test? option, the indicator will generate a sine wave based on the 3 cycle periods that you specify and pass it to the MEM algorithms as the input source.
In the snapshot above, we have generated a sine wave based on 60-period, 25-period, and 10-period cycles. Then we selected the Plot Forecast option with a 50-bar offset and a 50-bar plot extension. Even at bar 50 of the forecast it exactly matches the original sine wave, which shows just how powerful this autoregressive model can be, especially when dealing with a stationary time series.
See Also:

