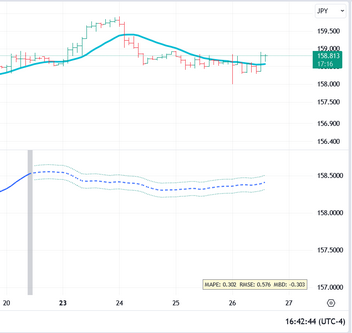
As mentioned in the Overview topic, if you generate a forecast when using an offset and a plot extension (meaning that there is out-of-sample data) the system will recognize this and will compare the forecast to the actual out-of-sample data to quantify the accuracy, and will plot 3 metrics in a dialog on the chart.
The metrics used are MAPE, RMSE, and MBD.
MAPE - Mean Absolute Percentage Error
•Expresses the errors as a percentage of the actual values
•Can be useful when you want a relative measure of error (i.e., the forecast is off by X%).
RMSE - Root Mean Squared Error
•Essentially the square root of MSE
•Often more interpretable than MSE since it uses the same units as the original data
•Punishes larger errors more than smaller ones.
MBD - Mean Bias Deviation
•Indicates whether the forecast consistently over-estimates (positive bias) or under-estimates (negative bias) the actual values.
As mentioned above, the values will be displayed in a small dialog box near the right-hand side of the chart. While one set of numbers may not be meaningful, they become more meaningful if you run a series of forecasts (i.e., after changing various settings) on the same input data. At that point you can use these metrics to compare the forecasts relative to one another.
In the event the forecast is longer than the out-of-sample data (or the forecast is shorter than the out-of-sample data), just the intersection will be evaluated. In the event there is no offset then no values will be displayed.

