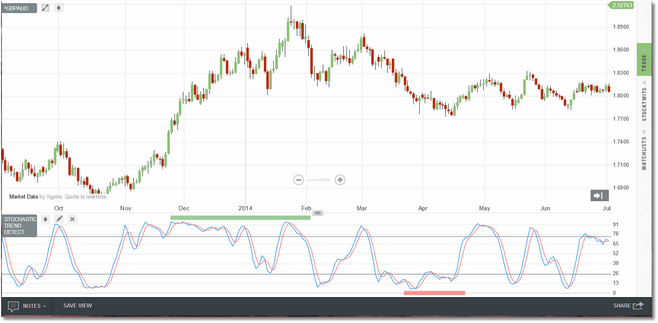
Stochastic TrendDetect is a conventional stochastics indicator that has been integrated with a trend/momentum detection algorithm designed to keep you on the right side of a trade. It will run on any bar interval/custom period available in Technician.
Initiating trades based on stochastic crossovers and/or excursions into overbought or oversold territory is a popular strategy on all timeframes. When a security is exhibiting cyclical behavior it can be very profitable. However when a trend emerges the strategy is inherently unreliable. The trend detection component of Stochastic TrendDetect (implemented as green and red bands above/below the stochastic plot) can help you stay out of trouble. When increasing bullish momentum is detected, a green band will begin drawing in the overbought region of the stochastic indicating that trades to the downside might not be advisable. When increasing bearish momentum is detected, a red band will begin drawing in the oversold region of the stochastic indicating that trades to the upside might not be advisable. In addition to the standard stochastics, the indicator provides user-defined upper and lower reference levels.
|
This indicator is very calculation-intensive and its use is not recommended if you are accessing Technician from a mobile device (i.e., Android or IOS). |
See Also:

