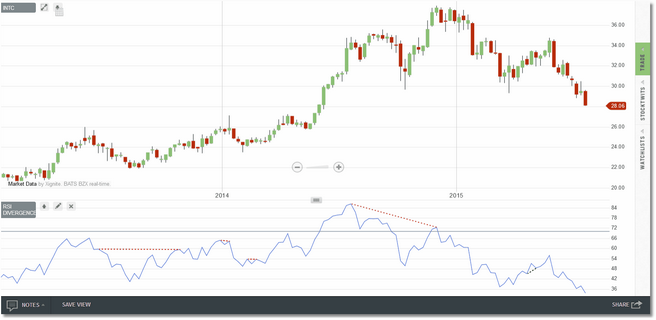
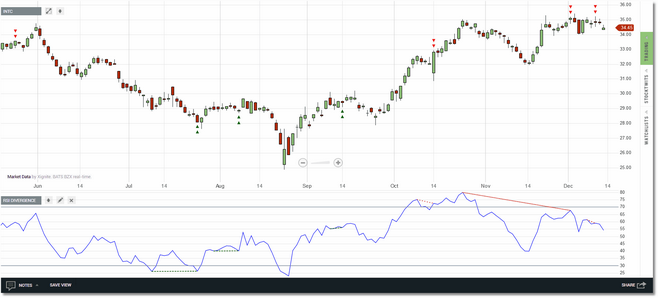
The RSI Divergence indicator implements "regular" and "hidden" divergence checking in a standard RSI indicator.
In addition to the divergence-specific parameters, options are provided for input length, upper/lower reference lines and cosmetics. Divergences will be identified based on the RSI plot versus the price action.
You can also elect to display the divergence signals in the chart pane as well as in the indicator pane by selecting the "Signals in Chart Pane?" option in the parameters dialog.
In the chart above you will notice the green and red arrows that are drawn in the price pane. If the "Signals in Chart Pane?" option is checked then these arrows will be drawn above/below the price bar that represents the end of the divergence. For a bearish divergence the arrows will be drawn above the bar, and for a bullish divergence the arrows will be drawn below the bar.
See Also:

