Keeping an eye on divergences between price action and an indicator is a great way to reduce risk as well as an excellent mechanism to identify optimum entry and exit points. There are two kinds of divergences: Regular and Hidden. While a "regular" divergence can indicate a reversal in trend, a "hidden" divergence can indicate a continuation in trend.
A "regular" divergence occurs when price is moving in one direction while an indicator is moving in the opposite direction. So, for example, if price is making a lower-low while CCI is making a higher-low this would be a "regular" divergence and would indicate a potential reversal in trend.
A "hidden" divergence also occurs when price is moving in one direction while an indicator is moving in the opposite direction, but it is the reverse of a "regular" divergence. So, for example, if price is making a higher-low while the indicator is making a lower-low, then this is an instance of a "hidden" divergence and would be an indication of potential trend continuation.
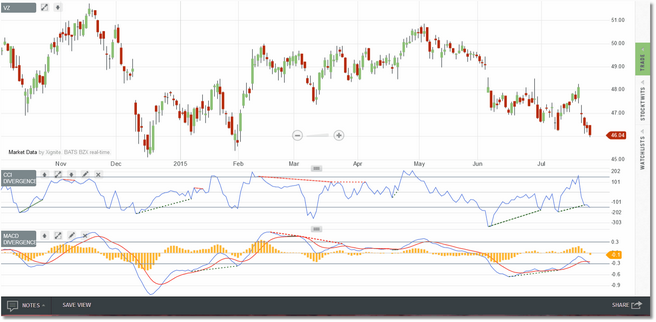
CCI and MACD divergence indicators (regular divergence) running in a VZ chart.
We have provided four popular indicators and have fitted them with our proprietary divergence-checking logic. The indicators are CCI Divergence, RSI Divergence, MACD Divergence, and Stochastic Divergence and all are capable of displaying either "regular" or "hidden" divergences. Which one you use is entirely up to you based on your preferences, but we will note that the CCI Divergence indicator seems to be the most robust when switching between various symbols and bar intervals.
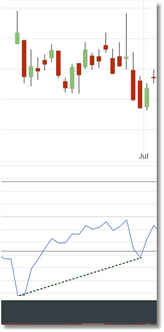
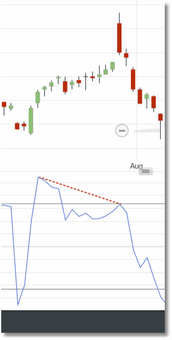
The divergences are indicated by green (bullish) or red (bearish) dashed lines drawn in the indicator pane:
•Bullish Divergence (regular)
Price is making a lower-low while the indicator is making a higher-low |
|
•Bearish Divergence (regular)
Price is making a higher-high while the indicator is making a lower-high. |
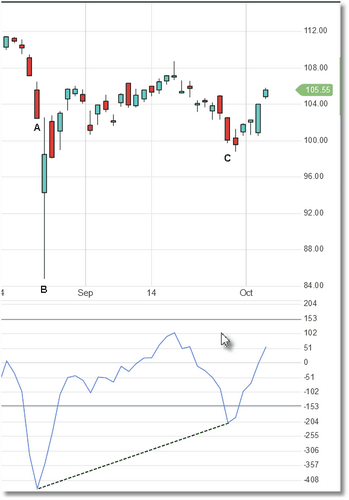
The divergence-checking logic is based on the peaks and troughs of the actual indicator, which is then compared to the actual lows (for bullish regular divergence) or highs (for bearish regular divergence) at those same points in time in the price data. Occasionally, because of sharp price action, a "bad" divergence will slip through so be sure to visually inspect the price action over the entire range before making a decision on a particular divergence.
The chart above is an example of a "bad" divergence. While
the low of the price bar at the beginning of the specified
divergence (A) is indeed higher than the low of the price bar at
the end of the divergence (C), there is a sharp down bar at
point (B) which technically cancels the divergence.
All of the divergence-checking indicators can be used on any bar interval/custom period available in Technician.
See Also:


