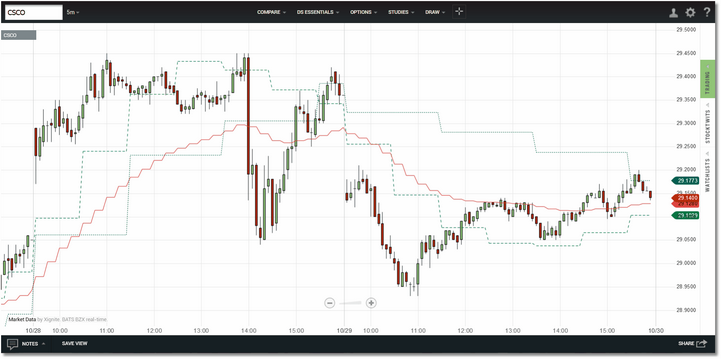
The Multi-Timeframe Moving Average is implemented as an overlay in Technician. It will calculate and display a moving average using the bar interval, moving average type, length, and price source that you have selected. This allows you to plot moving averages based on a bar interval that is higher than your current chart interval. If you do not specify a bar interval then the moving average will be calculated in the chart interval. Multiple moving averages can be loaded into the same chart.
In the 5-min CSCO chart above we have loaded 3 moving averages: a linear-regression average running in the 120-minute bar interval, a hull average
running in the 60-min bar interval, and an ema running in the 15-min bar interval.
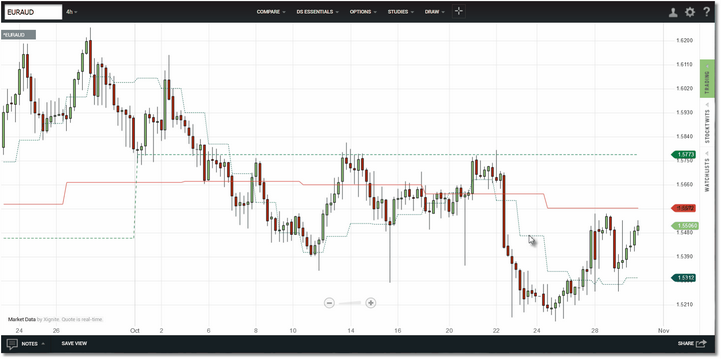
Daily, weekly, and monthly averages displayed in a 4-hour EURAUD chart.
The moving average types you can select from are sma (simple moving average), ema (exponential moving average), wma (weighted moving average), linReg (linear regression average), and hull (hull moving average). In addition to the standard OHLC chart type, the Multi-Timeframe Moving Average indicator can be used with the Heikin-Ashi, Kagi, Line Break and Range Bars chart types. It will not work with the Point & Figure or Renko chart types.
The available bar intervals that you can use are:
•Daily (input "D" or "d" or "day")
•Weekly (input "W" or "w" or "week" )
•Monthly (input "M" or "m" or "month")
•Any intraday bar interval from 1 (minute) up to 480.
The Multi-Timeframe Moving Average parameter menu dialog will allow you to input a intraday interval larger than 480 minutes, but the actual interval will be reduced to 480 minutes when the moving average is created.
|
Note: If the current chart interval is larger than the interval specified for the moving average, the average will use the chart interval for the calculation. If the chart interval is then changed to a value that is smaller than the interval specified for the moving average, the moving average will once again be calculated in the selected interval. |
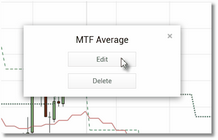
To remove a moving average from the chart, or to edit any of the settings, move your cursor over the the moving average plot. A small dialog will appear indicating that you should right-click to manage. Right-click in your chart and the Edit/Delete dialog will now be displayed:
Click Edit to access the parameter menu or
click Delete to remove the overlay.
|
Note: There is one situation where the Edit/Delete logic discussed above will not work. As an example...let's say you are in a 5-min chart and you load 3 moving averages...one using the 15-min interval, one using the 30-min interval, and one using the 60-min interval...and let's assume that the 3 averages all use the same length, and the same moving average type, and the same price source. On the 5-min chart they will all have unique plots since each is based on a different bar interval. However, if you change your chart interval to Daily, all 3 moving averages will now be using Daily data to calculate (i.e., since the moving average intervals you originally specified are now smaller than the chart interval) and they will all produce exactly the same plot. If you move your cursor over this "combined" plot and right-click...nothing will happen. So you will not be able to edit or delete any of the averages in this situation. The solution is simple: change the chart interval back to a lower interval so that all 3 averages have a unique plot and the Edit/Delete functionality will once again be available. |
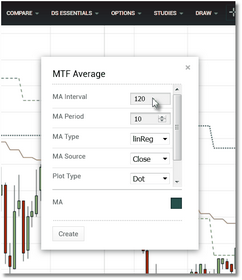
Click on the Edit button and the MTF Average parameters dialog will be displayed. See the Settings section for a complete description of all of the available parameters.
Make your settings changes and then click on
the Create button to apply them to the overlay.
See Also:


