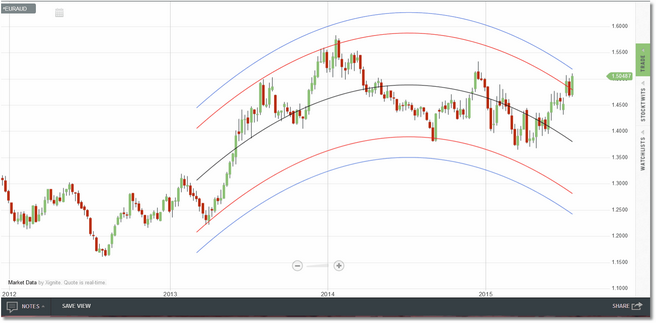
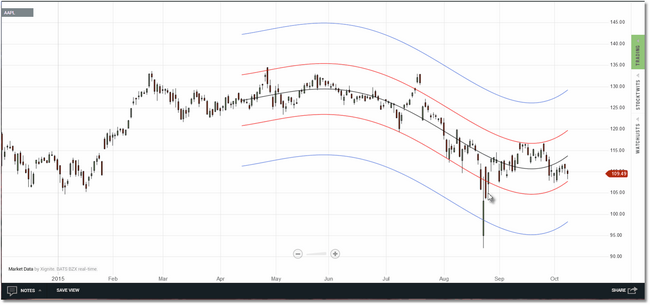
The Polynomial Bands indicator is a support/resistance tool and is based on the cycle work of JM Hurst. It calculates and displays a set of polynomial regression bands. You can select the polynomial order (1-4) as well as the number of standard deviations to use. The outer bands are standard deviation of price (conventional) added/subtracted relative to the basis line, while the inner bands are standard deviation of the difference between price and the basis line. As each new bar comes in, the polynomial regression will be recalculated based on the number of bars you have specified.
|
The formula in this indicator assumes fixed bar widths when performing its calculations. Because of this it will not plot correctly if used in a Volume Candle (a relatively new chart type in Technician that plots the candles in various widths depending upon the volume associated with that candle.) chart. |
Polynomial Bands with (default) polynomial order of 2.
Polynomial Bands with polynomial order of 4.
Polynomial Bands will run on any bar interval/custom period available in Technician.
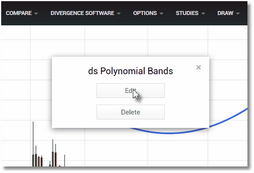
To remove the indicator from the chart, or to edit any of the settings, move your cursor over any of the plotted lines. A small dialog will appear indicating that you should right-click to manage. Right-click in your chart and the Edit/Delete dialog will now be displayed:
Click Edit to access the parameter menu or
click Delete to remove the overlay.
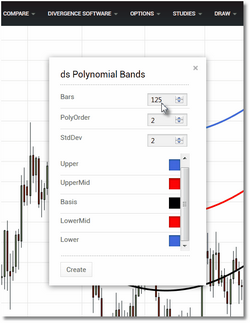
Click on the Edit button and the Polynomial Bands parameters dialog will be displayed. See the Settings section for a complete description of all of the available parameters.
Make your settings changes and then click on
the Create button to apply them to the overlay.
|
This indicator is very calculation-intensive and its use is not recommended if you are accessing Technician from a mobile device (i.e., Android or IOS). |
See Also:


