divergence software, inc.
Development & Consulting Services
TradingView Products
Below you will find a list of the indicators that we currently have available for the TradingView platform. We are adding indicators on a regular basis so be sure to check back often. If you purchase an indicator, be sure to send us your TradingView username (case-sensitive) so that we can activate the indicator(s) for your account.
If you would like to trial any of the indicators below, just send an email to support@sr-analyst.com and include your TradingView username along with the names of the indicators you would like to try, and we will set up a 14-day trial for you.
We also do custom development, so if you have a TradingView indicator or system that you would like developed, please send an email to support@sr-analyst.com with a description of your project and we will get back to you.
If you would like to be notified when we release new indicators then please join our Mailing List.
Don't have a TradingView account? Sign up for a free account today!
AB Oscillator for TradingView
TradingView indicators will automatically be activated for your TradingView account after purchase and no installation is required. Be sure to send us your TradingView Username after you purchase, and remember that the Usernames are case-sensitive.
Description
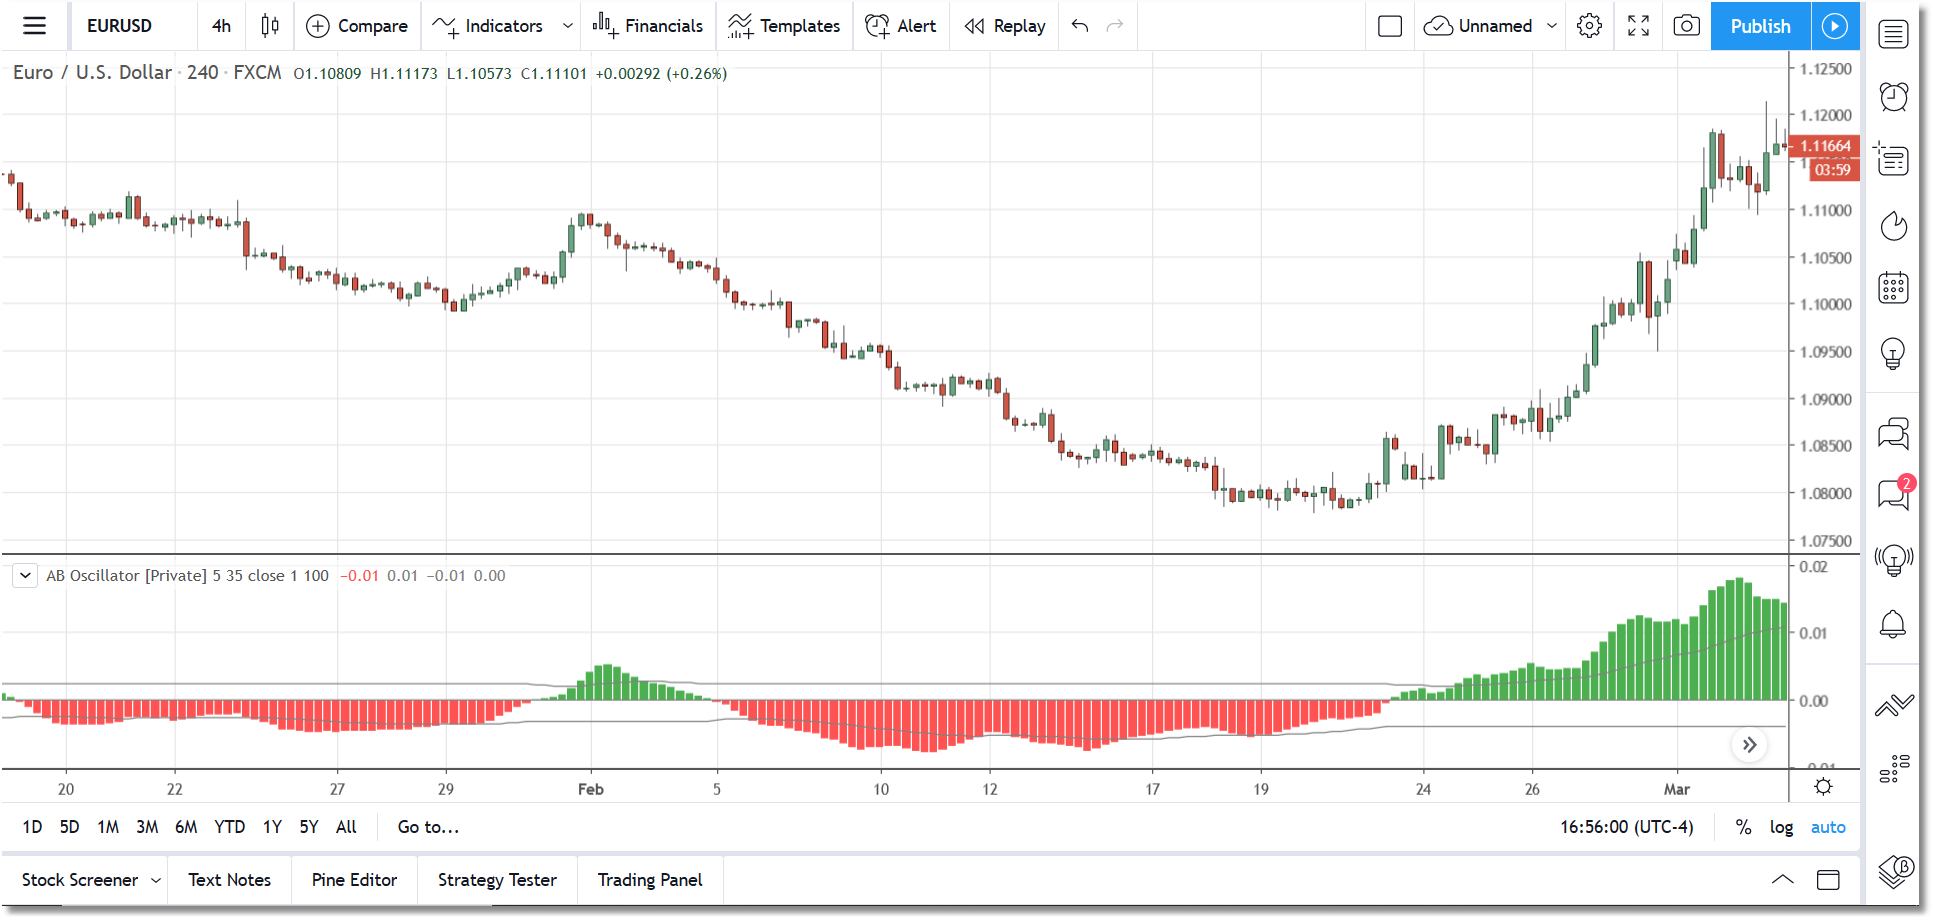
The AB Oscillator (aka Elliott Oscillator) plots a standard 5/35 simple moving average oscillator. It also incorporates two self-adjusting strength bands that can be used to identify Wave 3 and Wave 5 trends.
A Wave 3 condition is present when the oscillator is well above the upper band (or well below the lower band) and the distance between the two is steadily increasing. After the Wave 3 has completed, the oscillator should pull back to the zero-line or beyond.
The next push (Wave 5) will have less momentum and should be visible as a divergence between the price action and the oscillator. So in a bullish Wave 5 we will see higher-highs in the price but lower-highs in the oscillator when compared to the Wave 3 that preceded it.
Specifications
- Product ID: TV0008
- Study only, no source code provided
- Requires TradingView
- 14-day trial is available
- All prices are USD, one-time cost
- Payment via PayPal or Credit Card
AO Divergence for TradingView
TradingView indicators will automatically be activated for your TradingView account after purchase and no installation is required. Be sure to send us your TradingView Username after you purchase, and remember that the Usernames are case-sensitive.
Description
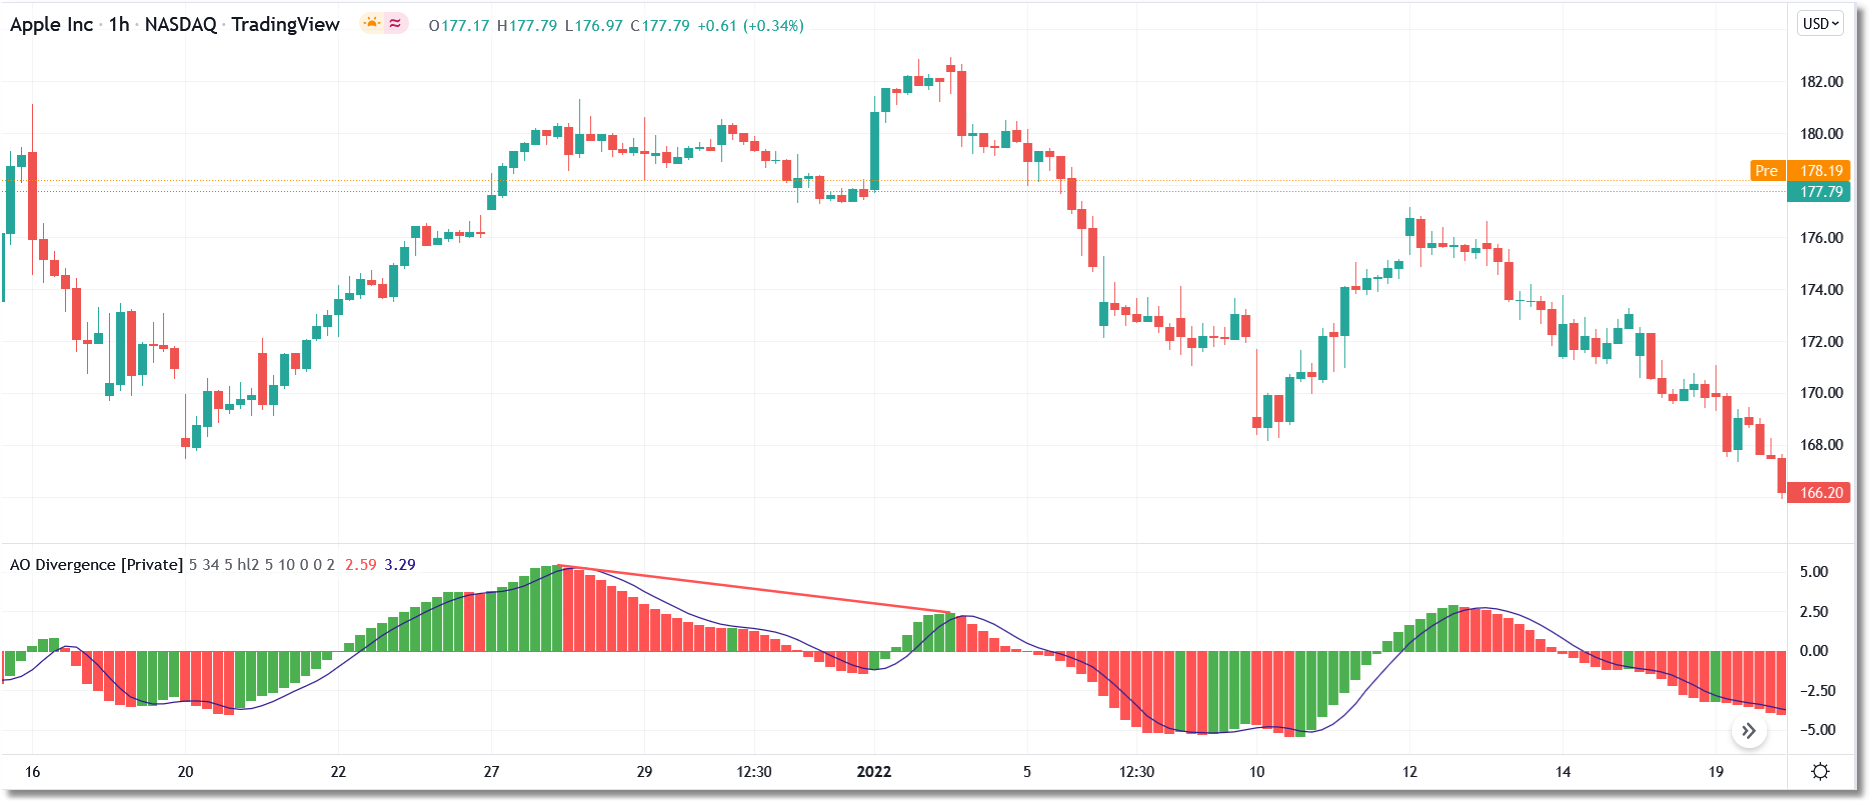
This indicator will identify divergences between price action and the AO indicator. A very thorough algorithm is used and it will accurately detect and/or extend all divergences. When the indicator is first loaded, it will mark all divergences found in the historical data and it will check for divergences as each new bar arrives in realtime. Several parameters are available to fine-tune the indicator operation. Alerts are included.
Specifications
- Product ID: TV0021
- Study only, no source code provided
- Requires TradingView
- 14-day trial is available
- All prices are USD, one-time cost
- Payment via PayPal or Credit Card
Avg Volume-At-Bar for TradingView
TradingView indicators will automatically be activated for your TradingView account after purchase and no installation is required. Be sure to send us your TradingView Username after you purchase, and remember that the Usernames are case-sensitive.
Description
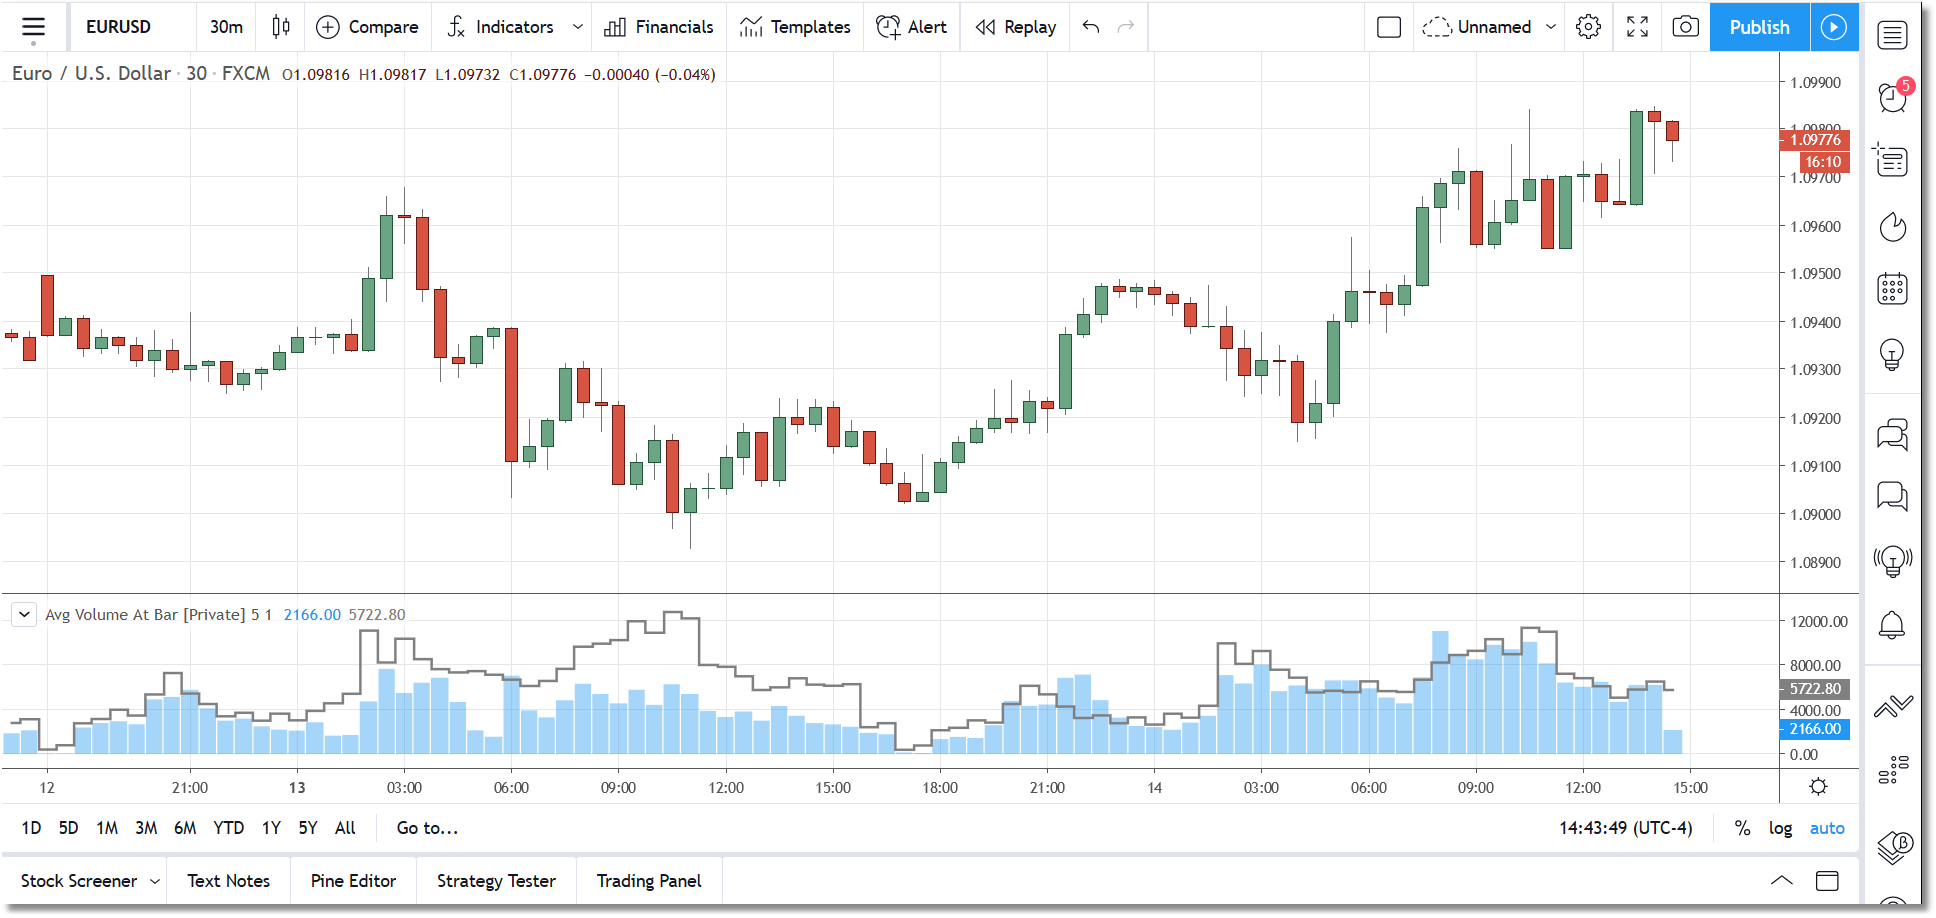
The Avg Volume-At-Bar indicator for TradingView provides a different way of looking at volume. Specifically it allows you to compare the volume at the current bar to volume as of the same time on prior days.
For example, if you set the Average Length to 1, then the indicator will display the prior-days volume over the current day's volume based on bar time. So on today's 10:00am bar it would display today's volume at 10:00am and would also display yesterday's volume as it was at 10:00am.
You can set the Average Length (which is measured in Days) from 1 to 5. As mentioned above, if Average Length is 1 then the indicator will simply display the volume from the prior day at that same bar time. If the Average Length is greater than 1 it will create an average and display that instead. So if Average Length is 5 (and assuming we are on the 10:00am bar) it will average the volume at the 10:00am bar over the prior 5 days and display that value.
A Multiplier input is also provided and the value specified will be applied to the calculated average. So, for example, if you set the Average Length to 5 and the Multiplier to 2.5 then the displayed value on each bar will be the 5-day average of the volume at that bar time multiplied by 2.5.
A TradingView alert condition will also be set whenever the current bar volume exceeds the calculated average volume.
The indicator will only operate on intraday minute charts. For 2-min charts and up your can use an Average Length from 1 to 5 days, and for 1-min charts you can only use an Average Length of 1 due to the cpu-intensive nature of the calculation.
Specifications
- Product ID: TV0017
- Study only, no source code provided
- Requires TradingView
- 14-day trial is available
- All prices are USD, one-time cost
- Payment via PayPal or Credit Card
Blau TSI Divergence for TradingView
TradingView indicators will automatically be activated for your TradingView account after purchase and no installation is required. Be sure to send us your TradingView Username after you purchase, and remember that the Usernames are case-sensitive.
Description
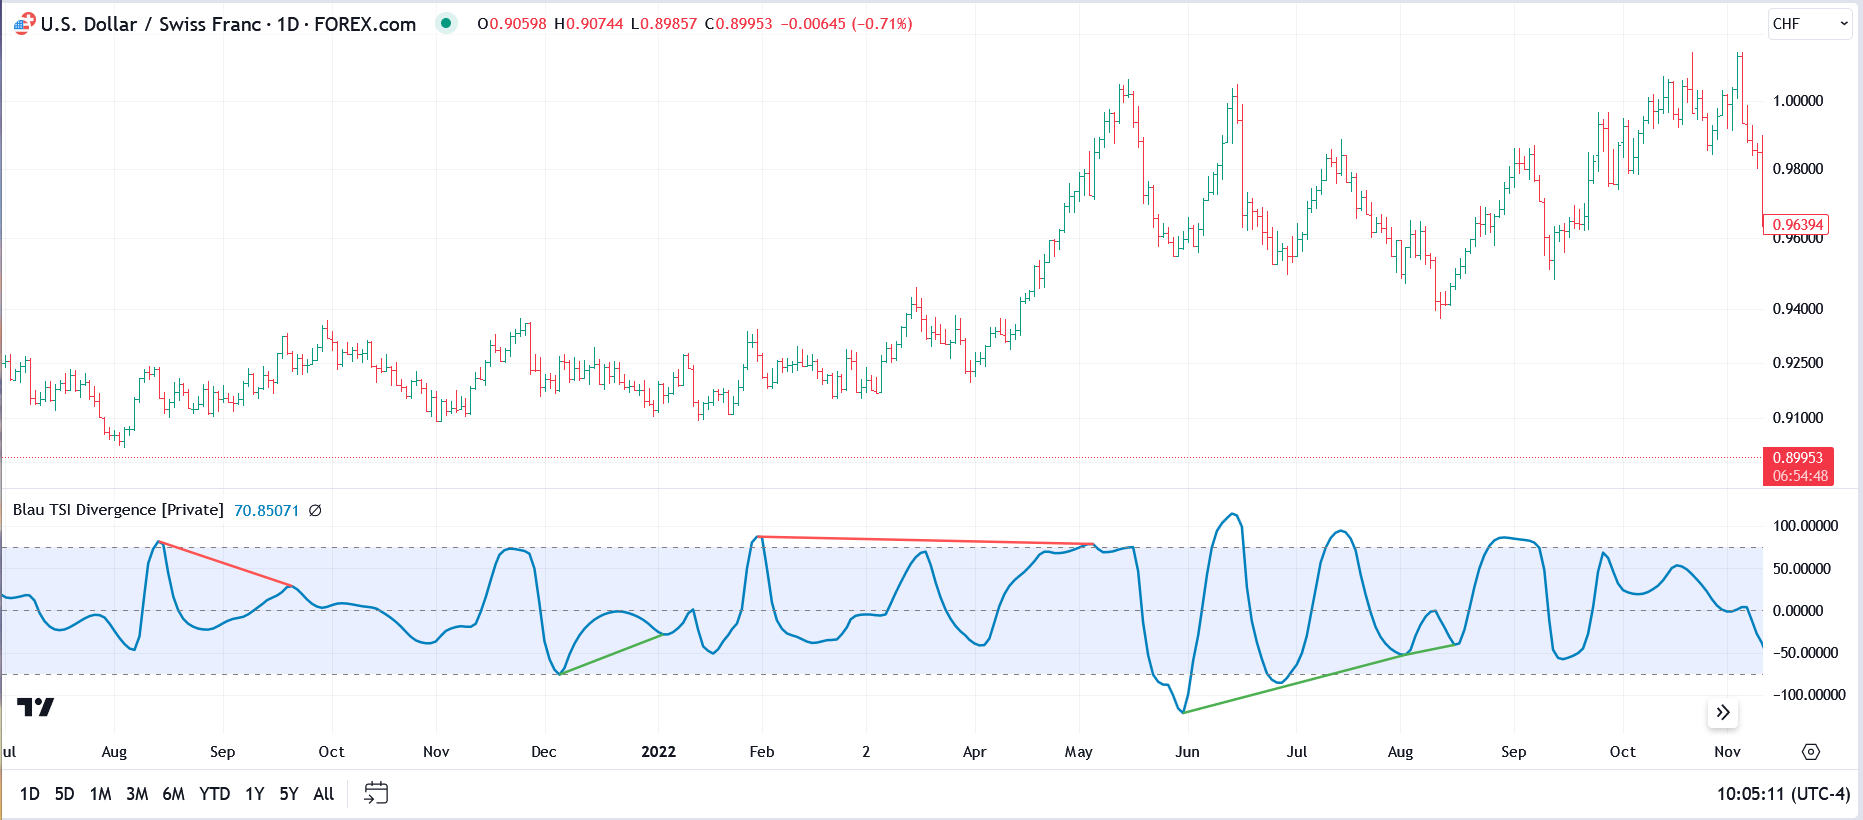
This indicator will identify divergences between price action and a customized implementation of the Blau TSI indicator. A very thorough algorithm is used and it will accurately detect and/or extend all divergences. When the indicator is first loaded, it will mark all divergences found in the historical data and it will check for divergences as each new bar arrives in realtime. Several parameters are available to fine-tune the indicator operation. Alerts are included.
Specifications
- Product ID: TV0065
- Study only, no source code provided
- Requires TradingView
- 14-day trial is available
- All prices are USD, one-time cost
- Payment via PayPal or Credit Card
Candlestick Patterns for TradingView
TradingView indicators will automatically be activated for your TradingView account after purchase and no installation is required. Be sure to send us your TradingView Username after you purchase, and remember that the Usernames are case-sensitive.
Description
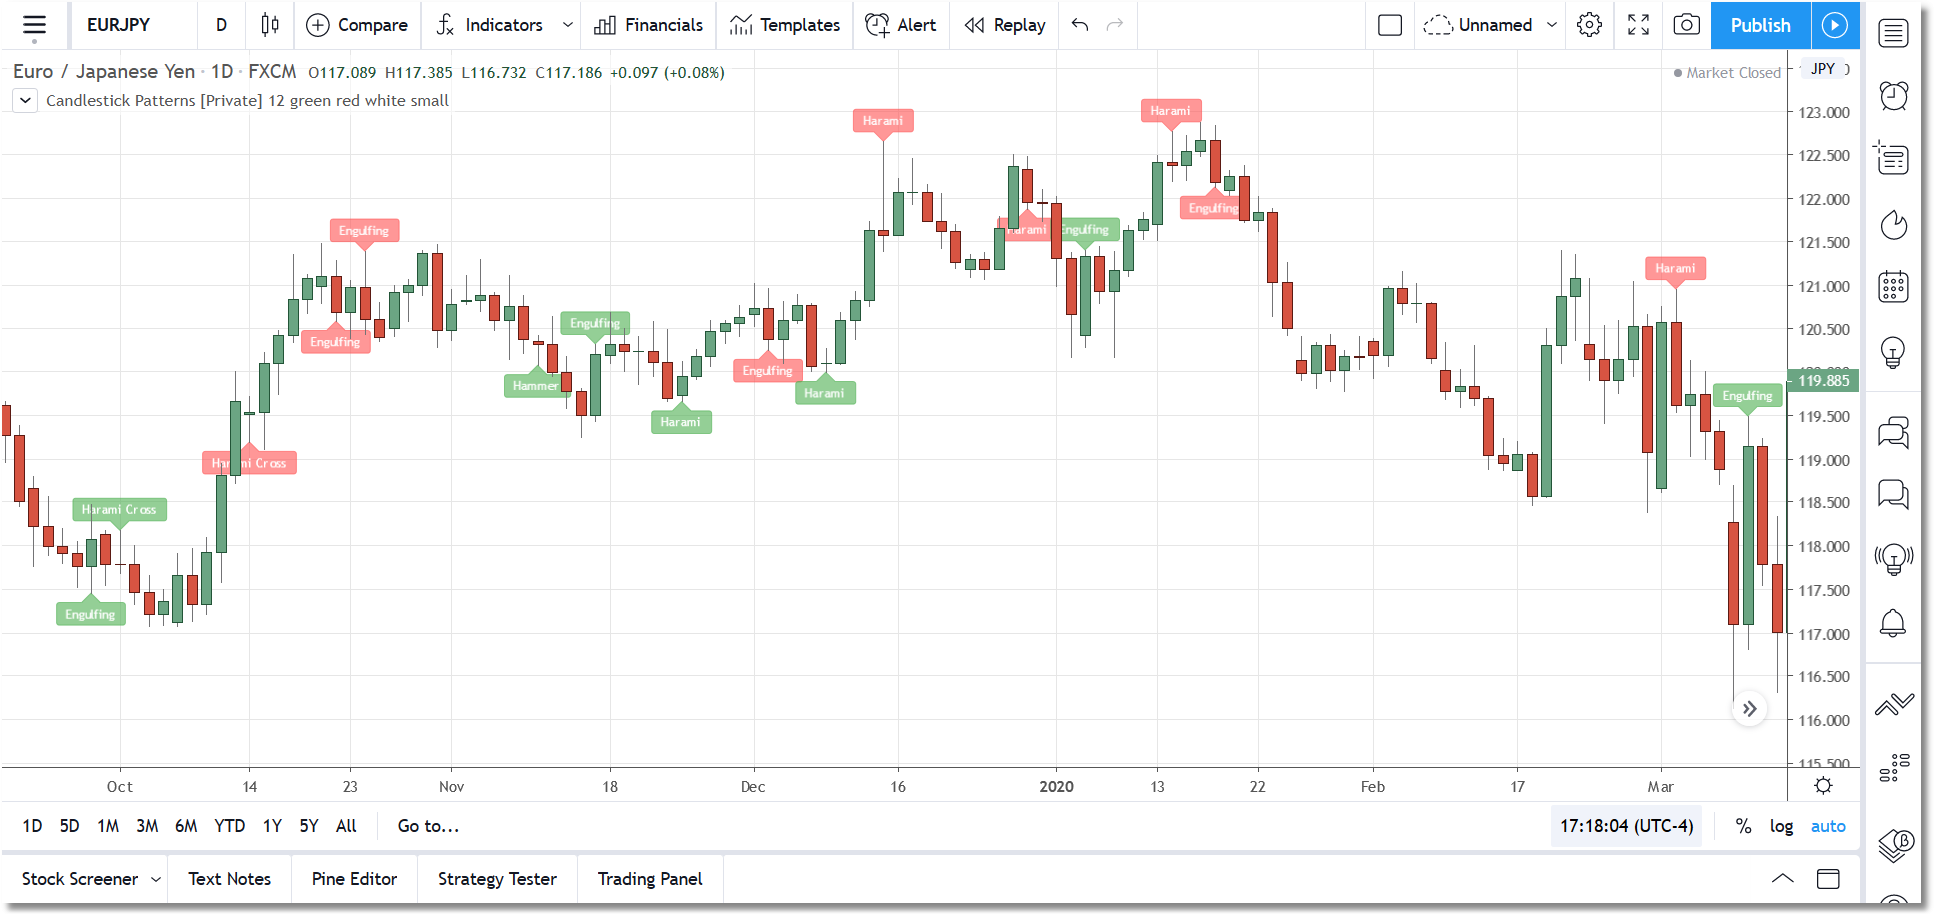
Candlestick patterns are as popular now as they ever were, and our Candlestick Patterns indicator for TradingView makes it easy to integrate candle patterns into your trading.
The indicator tracks bullish and bearish versions of 15 of the most popular candlestick patterns. Each pattern can be toggled on/off individually and you can also filter for bullish only or bearish only patterns.
You can also adjust the colors used for bullish and bearish candle patterns, as well as the label size.
The candlestick patterns tracked are:
- Dark Cloud/Piercing Line
- Doji
- Engulfing
- Up/Down Gap
- Hammer/Hanging Man
- Harami
- Harami Cross
- Kicking
- Morning/Evening Star
- Shooting Star
- Tasuki Gap
- TriStar
- 3 Soldiers/3 Crows
- Three Inside
- Three Outside
Specifications
- Product ID: TV0012
- Study only, no source code provided
- Requires TradingView
- 14-day trial is available
- All prices are USD, one-time cost
- Payment via PayPal or Credit Card
CCI Divergence for TradingView
TradingView indicators will automatically be activated for your TradingView account after purchase and no installation is required. Be sure to send us your TradingView Username after you purchase, and remember that the Usernames are case-sensitive.
Description
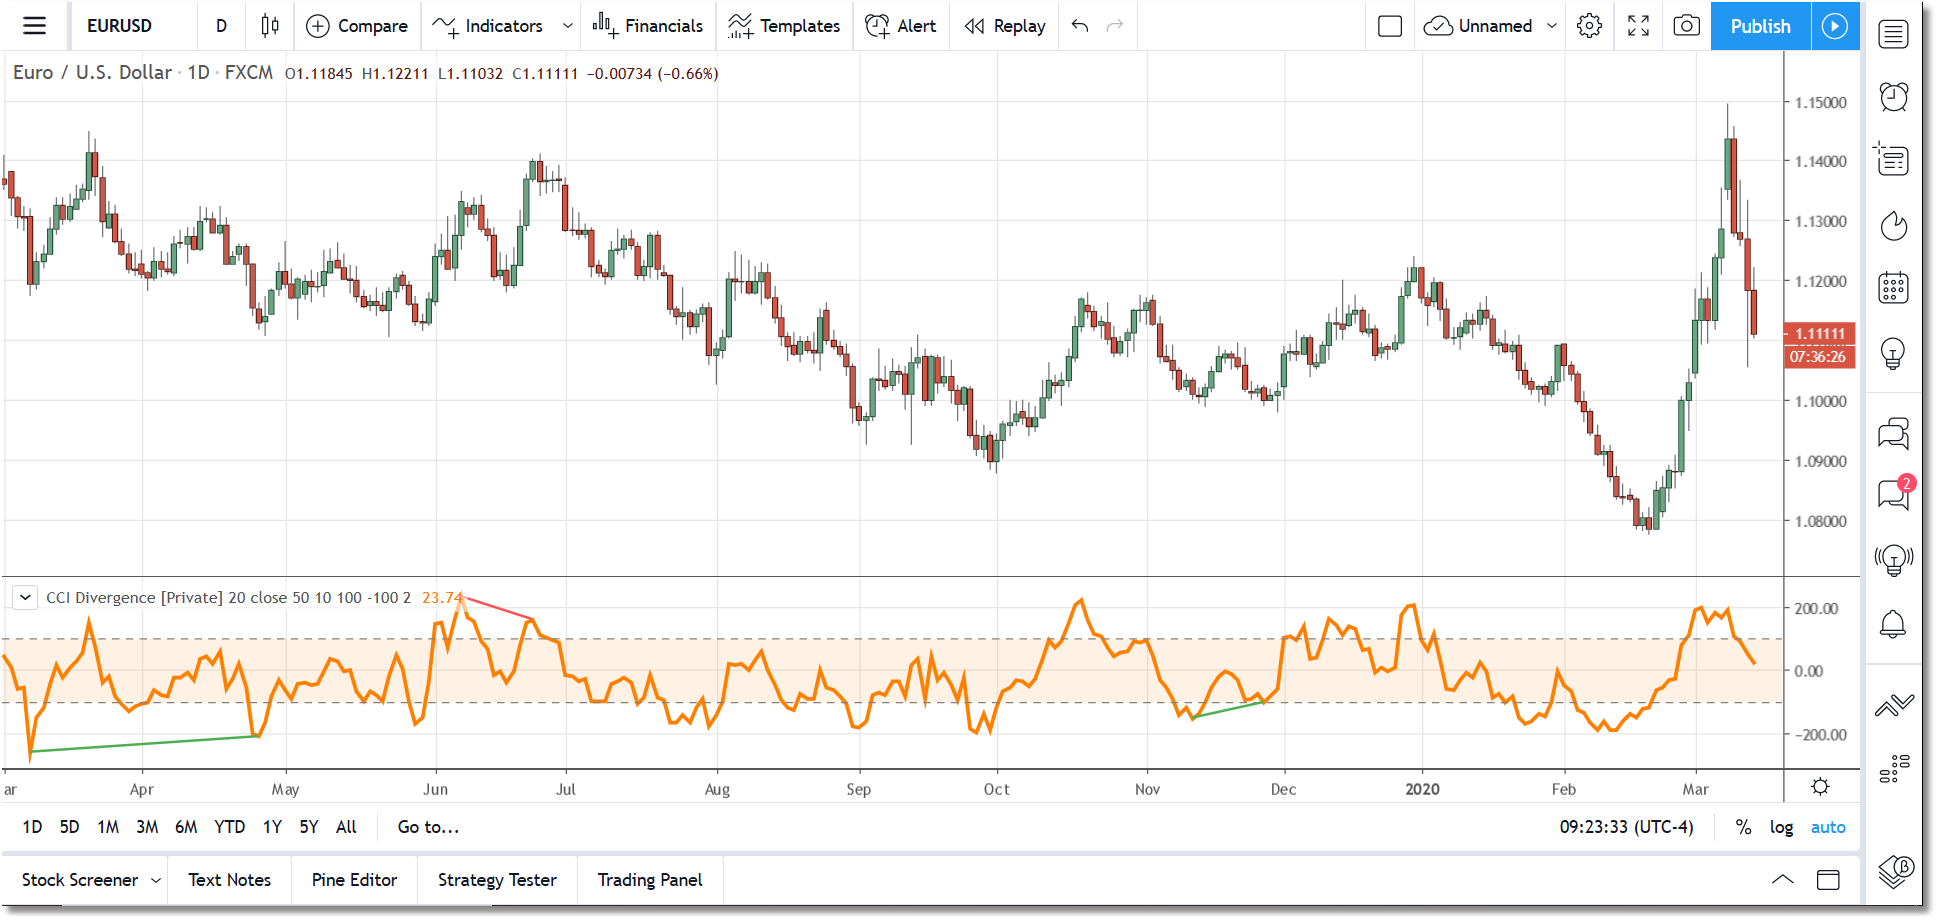
This indicator will identify divergences between price action and the CCI. A very thorough algorithm is used and it will accurately detect and/or extend all divergences. When the indicator is first loaded, it will mark all divergences found in the historical data and it will check for divergences as each new bar arrives in realtime. Several parameters are available to fine-tune the indicator operation. Alerts are included.
Specifications
- Product ID: TV0005
- Study only, no source code provided
- Requires TradingView
- 14-day trial is available
- All prices are USD, one-time cost
- Payment via PayPal or Credit Card
cycleAnalyzer for TradingView
TradingView indicators will automatically be activated for your TradingView account after purchase and no installation is required. Be sure to send us your TradingView Username after you purchase, and remember that the Usernames are case-sensitive.
Description
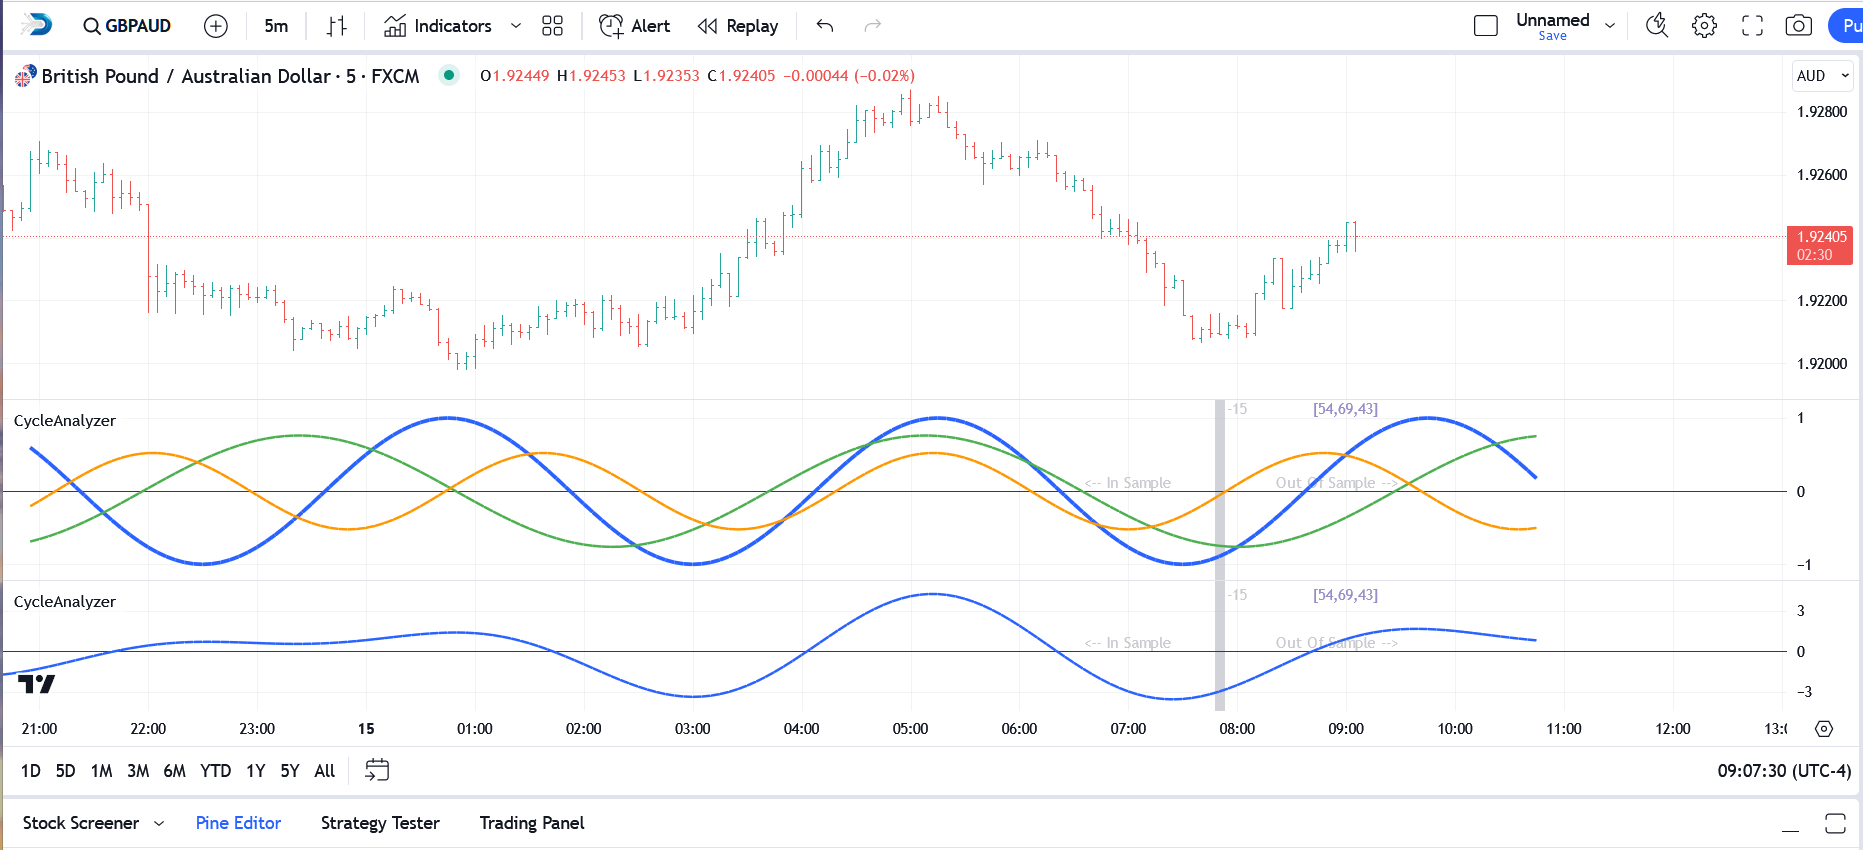
cycleAnalyzer for TradingView uses digital signal processing (DSP) techniques to extract the three strongest cycles from the price data, and these are displayed in the correct phase and relative amplitude, or you can display a composite plot. Both of these options provide a very graphical view of a security's cyclical behavior. Provide your TradingView Username at time of purchase.
Click on the More Info button below to access the User Guide.
Specifications
- Product ID: TV0001
- Study only, no source code provided
- Requires TradingView
- 14-day trial is available
- All prices are USD, one-time cost
- Payment via PayPal or Credit Card
cycleProjector for TradingView
TradingView indicators will automatically be activated for your TradingView account after purchase and no installation is required. Be sure to send us your TradingView Username after you purchase, and remember that the Usernames are case-sensitive.
Description
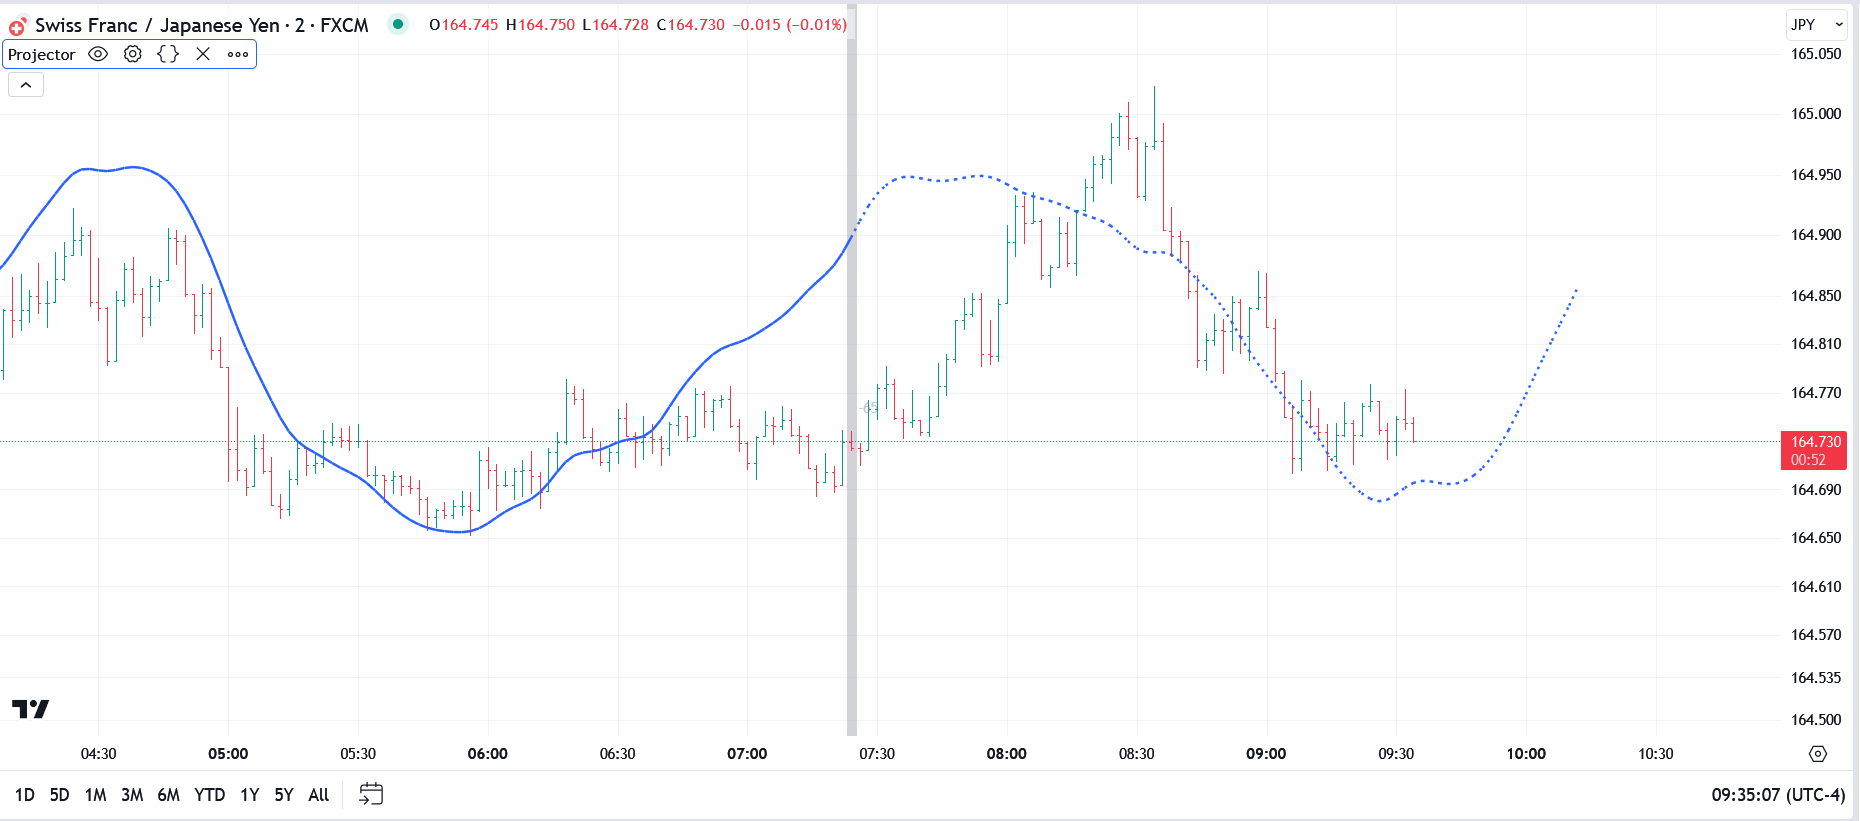
cycleProjector Projector for TradingView uses digital signal processing (DSP) techniques to extract all of the cycles from the price data, filter out the noise, and re-assemble those cycles in a composite plot that is then displayed overlaying the price action in the price pane. An offset option is provided so you can view both In-Sample and Out-of-Sample plots, which you can use to gauge the effectiveness of the cycle analysis. This is a companion product to our cycleAnalyzer for TradingView.
Specifications
- Product ID: TV0051
- Study only, no source code provided
- Requires TradingView
- 14-day trial is available
- All prices are USD, one-time cost
- Payment via PayPal or Credit Card
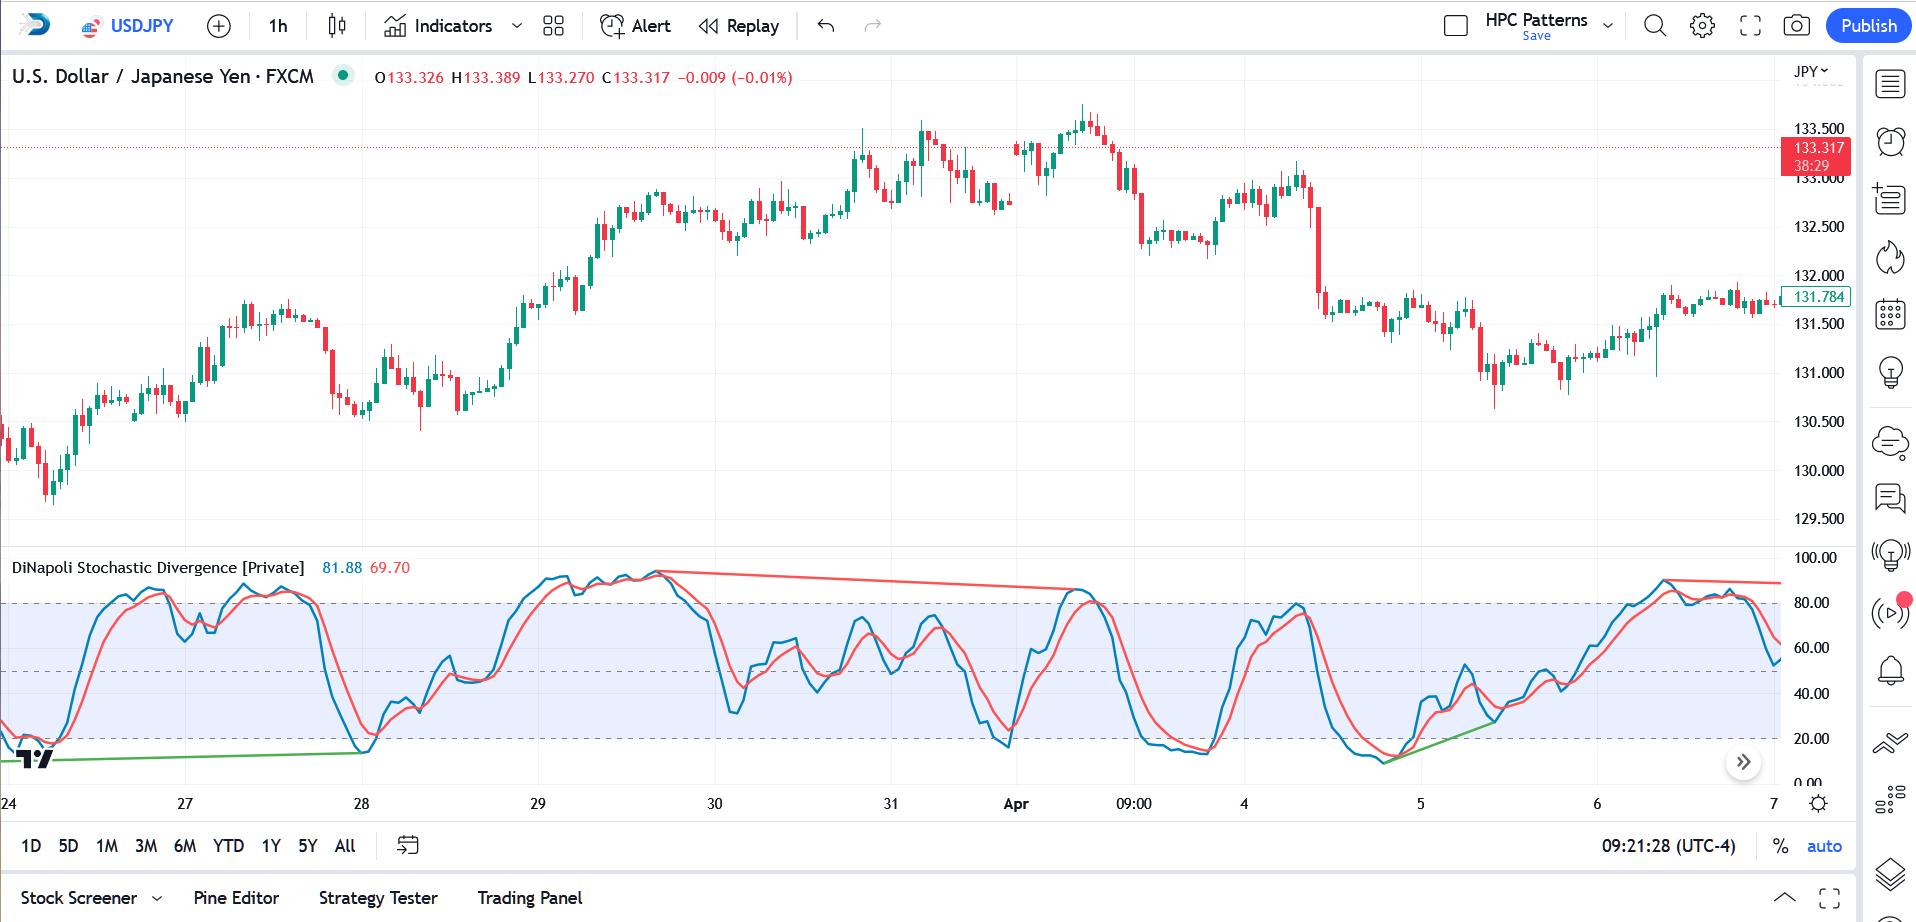
DiNapoli Stochastic Divergence for TradingView
TradingView indicators will automatically be activated for your TradingView account after purchase and no installation is required. Be sure to send us your TradingView Username after you purchase, and remember that the Usernames are case-sensitive.
Description
This indicator will identify divergences between price action and the DiNapoli Stochastic %K or %D. A very thorough algorithm is used and it will accurately detect and/or extend all divergences. When the indicator is first loaded, it will mark all divergences found in the historical data and it will check for divergences as each new bar arrives in realtime. Several parameters are available to fine-tune the indicator operation. Alerts are included.
Specifications
- Product ID: TV0023
- Study only, no source code provided
- Requires TradingView
- 14-day trial is available
- All prices are USD, one-time cost
- Payment via PayPal or Credit Card
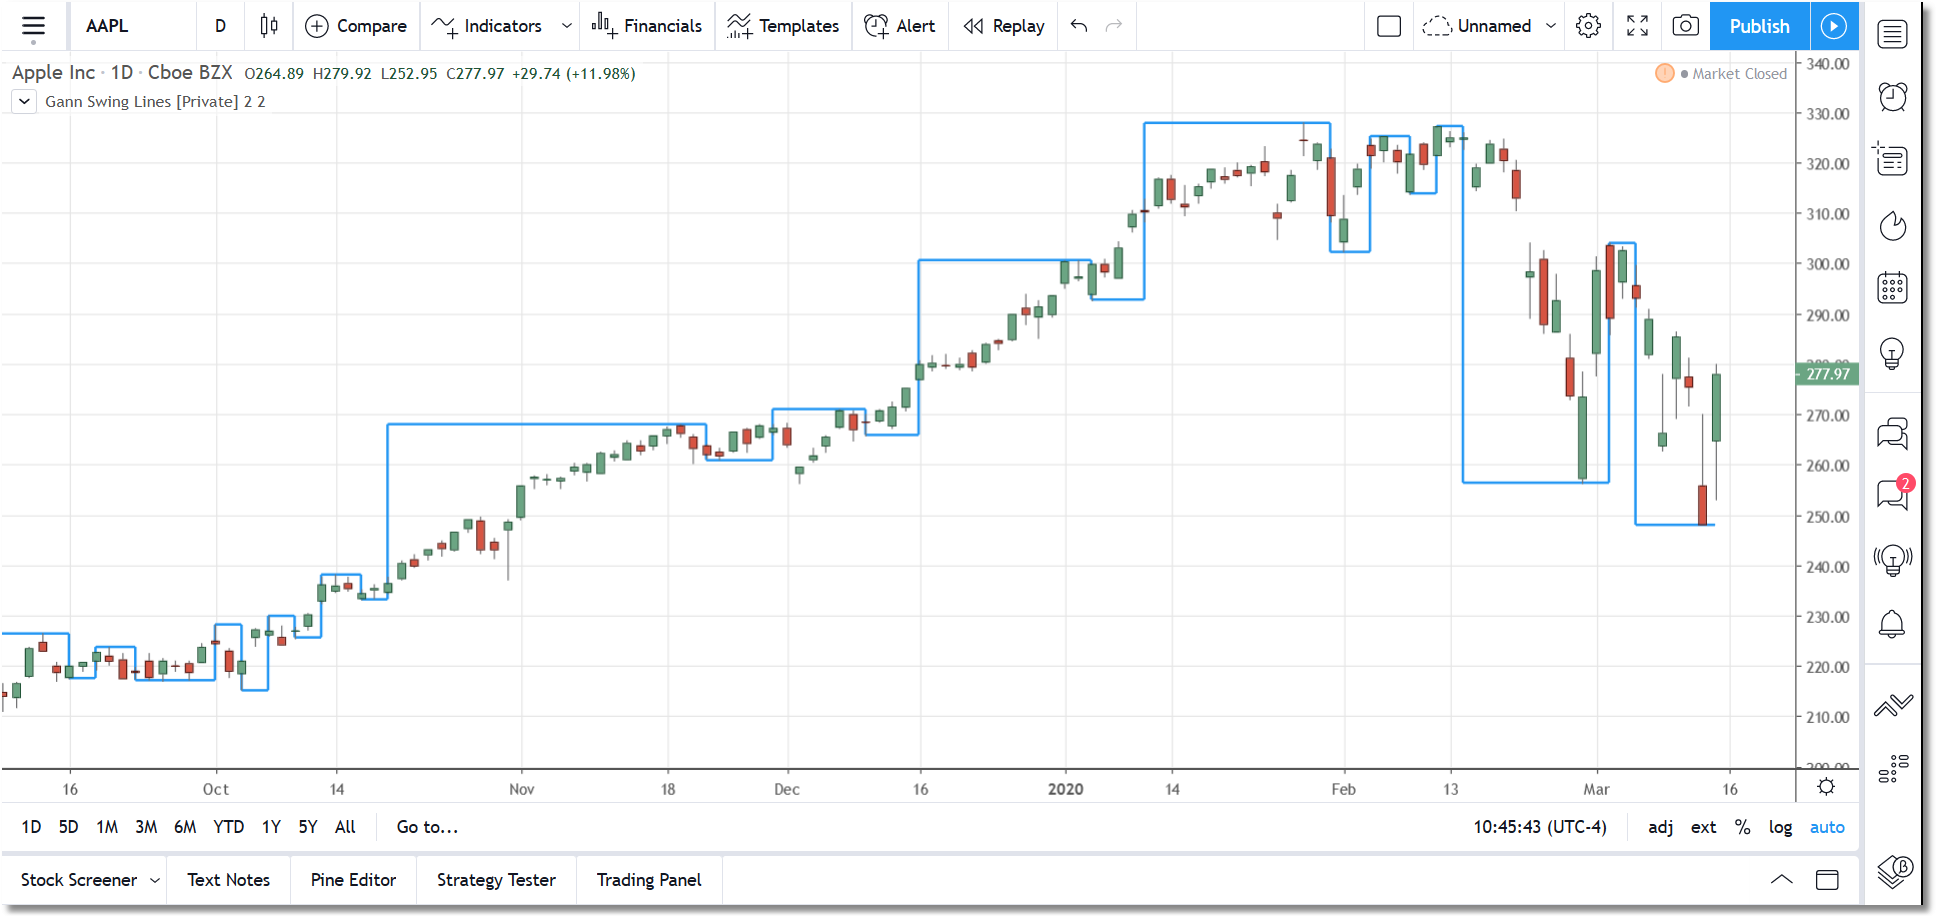
Gann Swing Lines for TradingView
TradingView indicators will automatically be activated for your TradingView account after purchase and no installation is required. Be sure to send us your TradingView Username after you purchase, and remember that the Usernames are case-sensitive.
Description
The Gann Swing Lines indicator is a correct implementation of the classic Gann Swing Chart for the TradingView platform. You can adjust the swing period from 1 to 50 bars (the default is 2) and you can also select whether or not to include outside bars in the calculation. The Manhattan Chart display makes it easy to visualize the swings and also to objectively determine the current trend.
A series of lower Ganns Swing highs and lows indicate a down trend, and a series of higher Gann Swing highs and lows indicate an up trend. Periods of alternating Gann Swing highs and lows indicate consolidation. In addition to trend determination, prior Gann Swing levels are often important support and resistance levels.
We are limited in TradingView to the total number of line objects that we can draw on a chart at any given time and that number is currently around 50. If you use a small Gann Swing period then the historical plot will be limited.
Specifications
- Product ID: TV0009
- Study only, no source code provided
- Requires TradingView
- 14-day trial is available
- All prices are USD, one-time cost
- Payment via PayPal or Credit Card
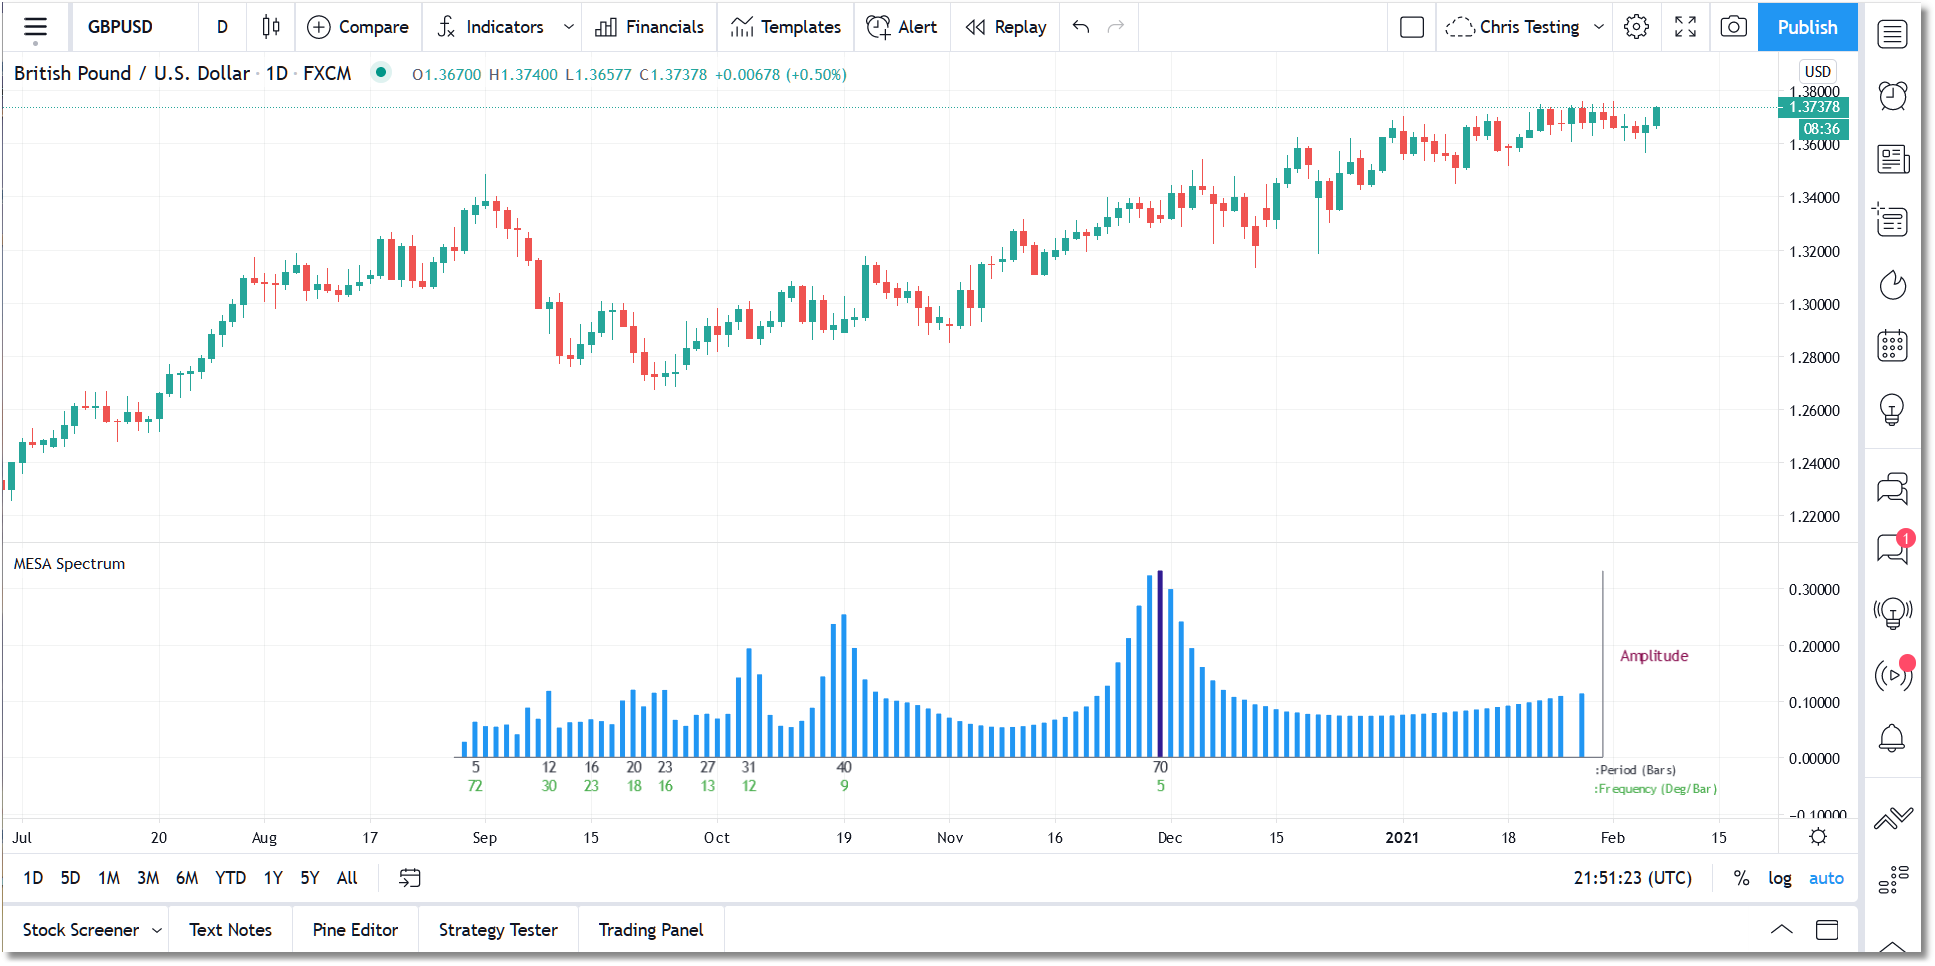
MESA Spectrum for TradingView
TradingView indicators will automatically be activated for your TradingView account after purchase and no installation is required. Be sure to send us your TradingView Username after you purchase, and remember that the Usernames are case-sensitive.
Description
This indicator calculates the power spectrum of a data series using the Maximum Entropy Spectrum Estimation method and produces a power spectrum plot. The Maximum Entropy algorithm, unlike a simple FFT transform, will include frequencies from the entire complex frequency plane and not just the Nyquist interval which, in general terms, means that it can resolve cycle periods that are larger than the data window passed to the function. In addition, MESA has the ability to fit very sharp spectral features which are often missed by other analysis methods. The displayed power spectrum will highlight the dominant cycles and frequencies within the data and will display the Period and Frequency below each peak. Prior to being passed to the MESA algorithm, the price data is detrended using a least means squared filter.
Specifications
- Product ID: Tv0019
- Study only, no source code provided
- Requires TradingView
- 14-day trial is available
- All prices are USD, one-time cost
- Payment via PayPal or Credit Card
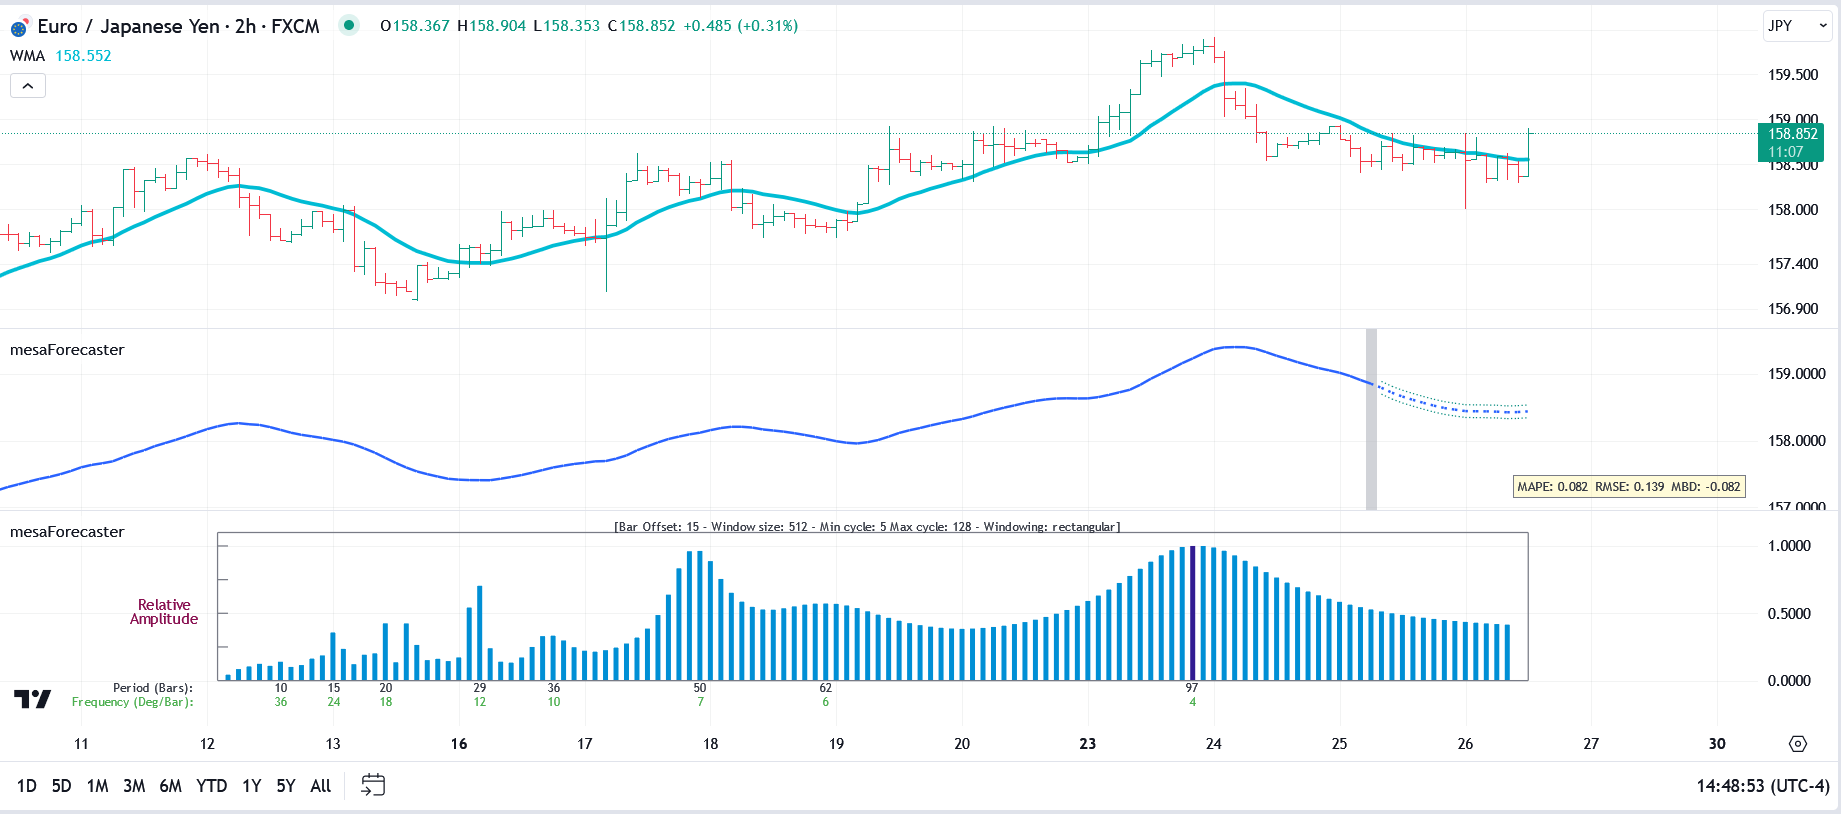
mesaForecaster for TradingView
TradingView indicators will automatically be activated for your TradingView account after purchase and no installation is required. Be sure to send us your TradingView Username after you purchase, and remember that the Usernames are case-sensitive.
Description
Probably the most powerful and complex indicator we have created to-date. mesaForecaster for TradingView uses autoregressive (AR) algorithms and digital signal processing (DSP) techniques to provide you with several useful time series analyses.
As the name suggests, forecasting is the primary function of the indicator, and it does that very well using an autoregressive model based on the Burg algorithm. But it also provides several cycle-analysis plots (i.e., top 3 cycles, dominant cycle only, and composite) as well as a full power spectrum plot.
Much more detailed information can be found in the User Guide. See the More Info link below.
Specifications
- Product ID: TV0056
- Study only, no source code provided
- Requires TradingView
- 14-day trial is available
- All prices are USD, one-time cost
- Payment via PayPal or Credit Card
MoneyFlow Divergence for TradingView
TradingView indicators will automatically be activated for your TradingView account after purchase and no installation is required. Be sure to send us your TradingView Username after you purchase, and remember that the Usernames are case-sensitive.
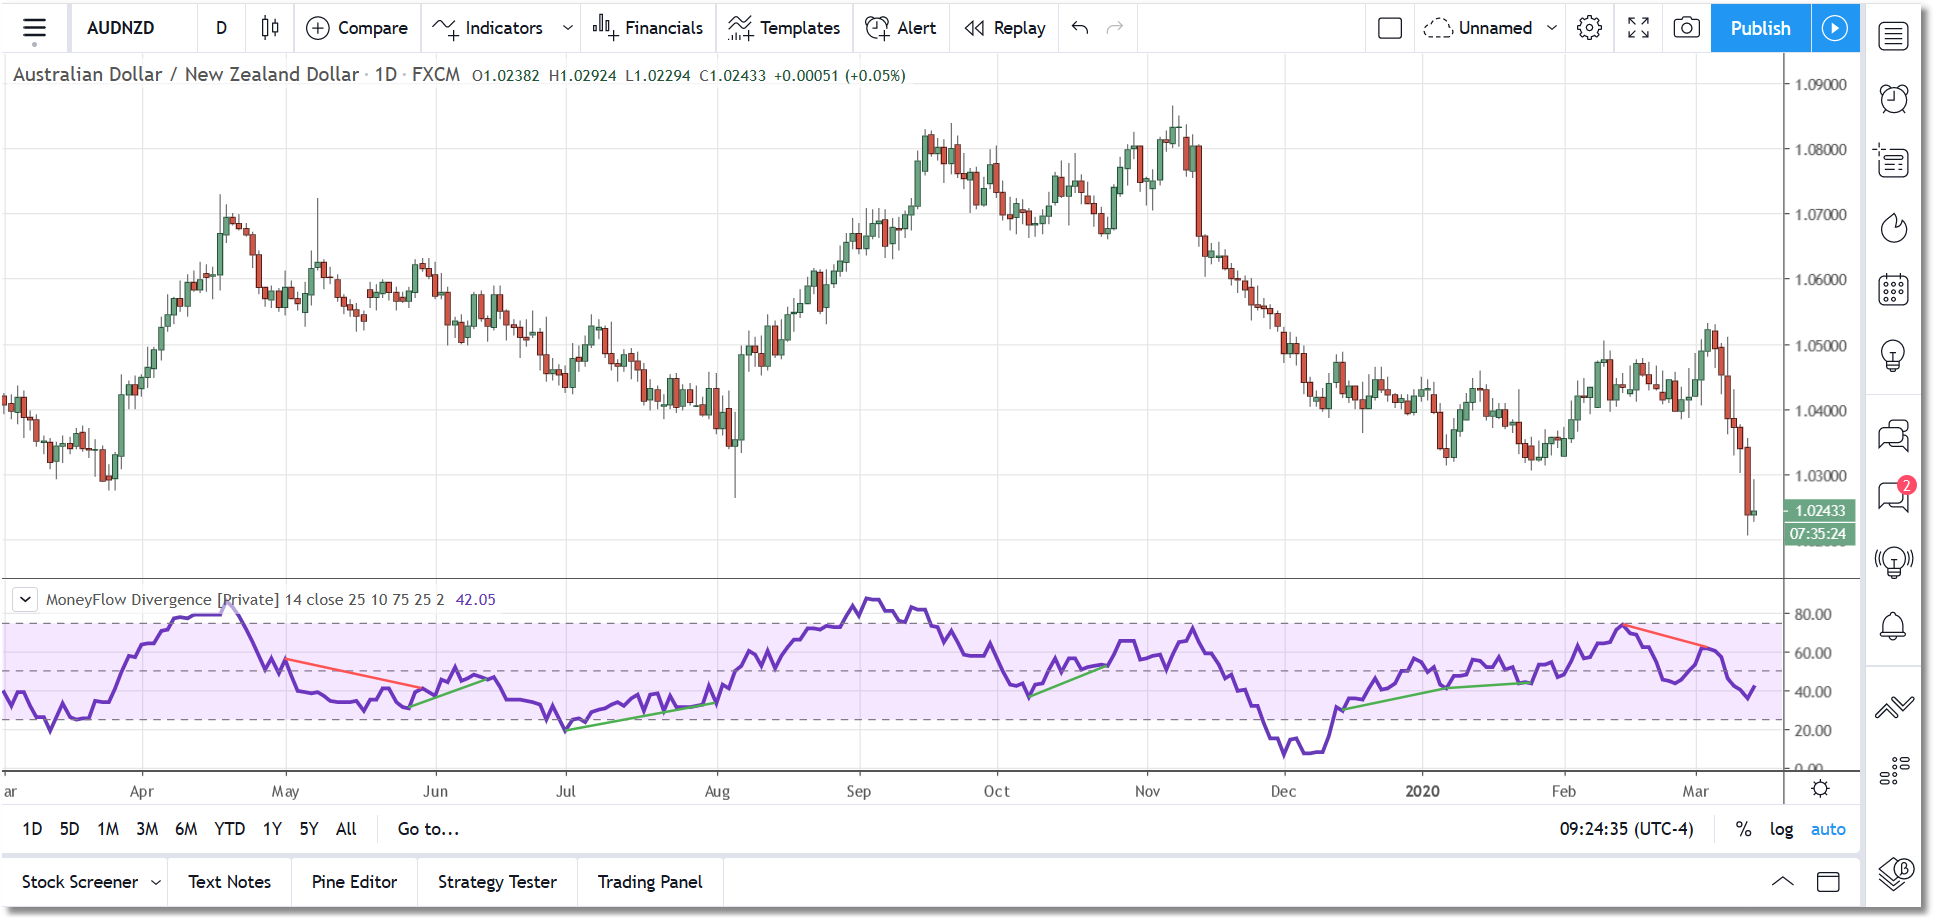
Description
This indicator will identify divergences between price action and the Money Flow Index. A very thorough algorithm is used and it will accurately detect and/or extend all divergences. When the indicator is first loaded, it will mark all divergences found in the historical data and it will check for divergences as each new bar arrives in realtime. Several parameters are available to fine-tune the indicator operation. Alerts are included.
Specifications
- Product ID: TV0006
- Study only, no source code provided
- Requires TradingView
- 14-day trial is available
- All prices are USD, one-time cost
- Payment via PayPal or Credit Card
Multi-Timeframe Blau TSI for TradingView
TradingView indicators will automatically be activated for your TradingView account after purchase and no installation is required. Be sure to send us your TradingView Username after you purchase, and remember that the Usernames are case-sensitive.
Description
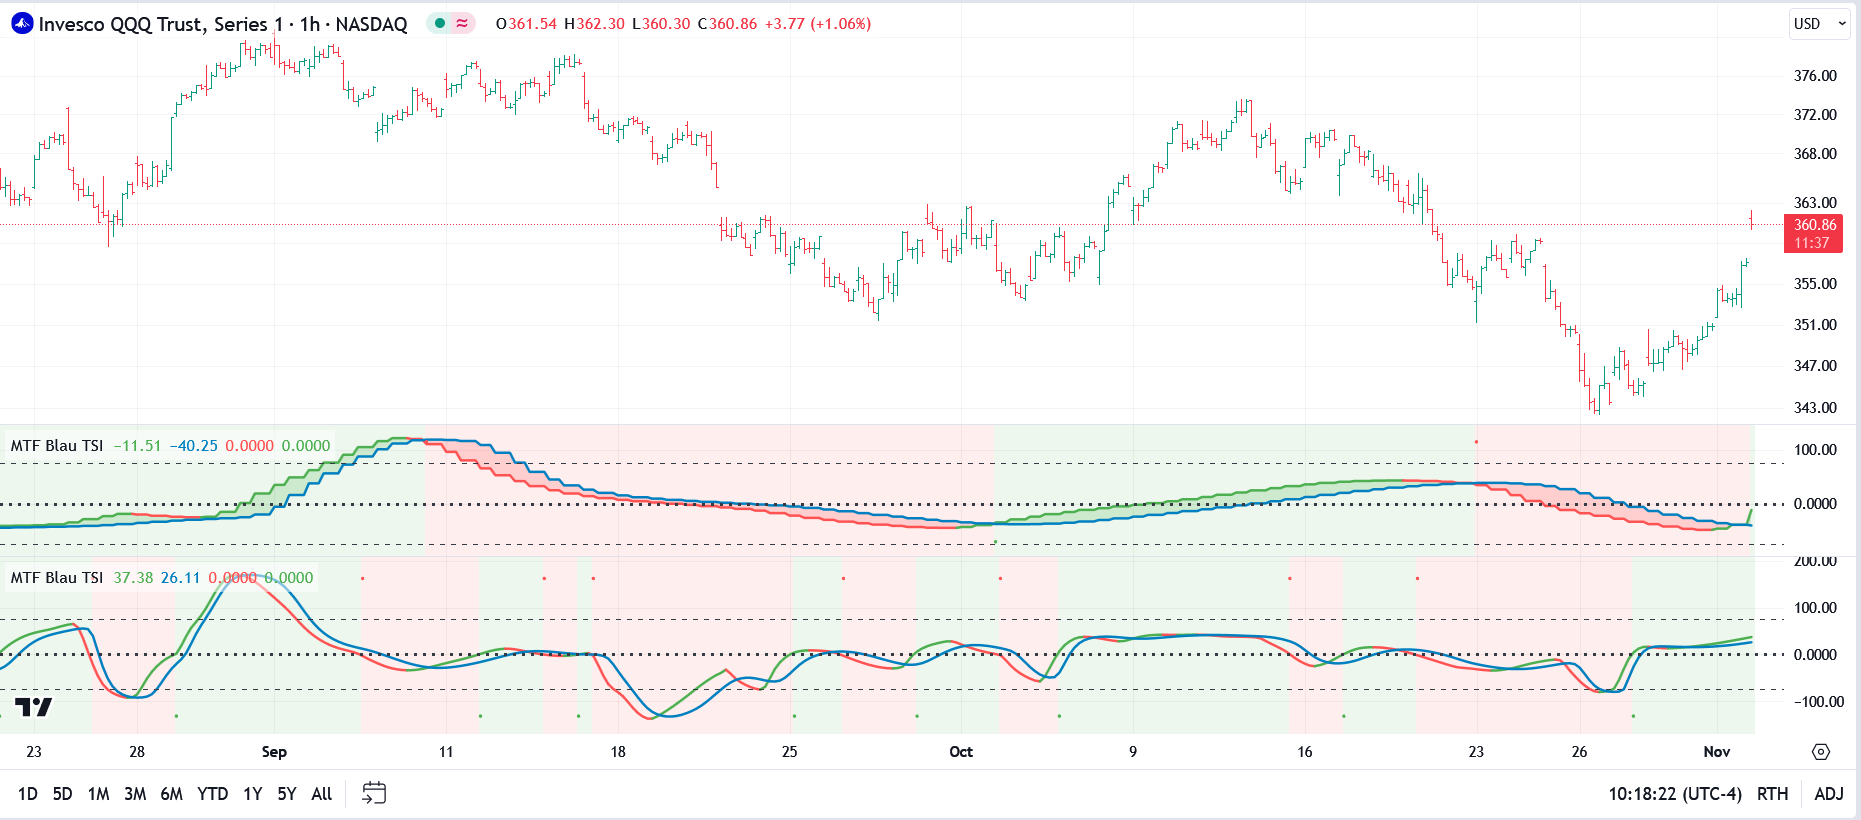
MTF Blau TSI is a multi-timeframe adaptation of the original True Strength Index momentum oscillator. It can be used to indicate trend direction as well as overbought/oversold conditions. In addition to the multi-timeframe capability, this TSI is very responsive yet remains extremely smooth regardless of the settings used.
A typical approach would be to add two MTF Blau TSI indicators into your chart, set both to color the background, and set one copy to a higher interval. For the higher-interval copy set the Crossover Type to Signal, and for the chart-interval copy set the Crossover Type to Zero-Line. Then you can look for zero-crosses in the chart time interval that are in the same direction as the higher interval (i.e., if TSI in higher interval has a green background then look for crosses above the zero-line in the chart interval and vice-versa).
The indicator is highly customizable with options for crossover highlighting, background highlighting, adjustable reference lines, and automatic or manual higher-timeframe selection.
Specifications
- Product ID: TV0063
- Study only, no source code provided
- Requires TradingView
- 14-day trial is available
- All prices are USD, one-time cost
- Payment via PayPal or Credit Card
Multi-Timeframe Hi/Lo Levels for TradingView
TradingView indicators will automatically be activated for your TradingView account after purchase and no installation is required. Be sure to send us your TradingView Username after you purchase, and remember that the Usernames are case-sensitive.
Description
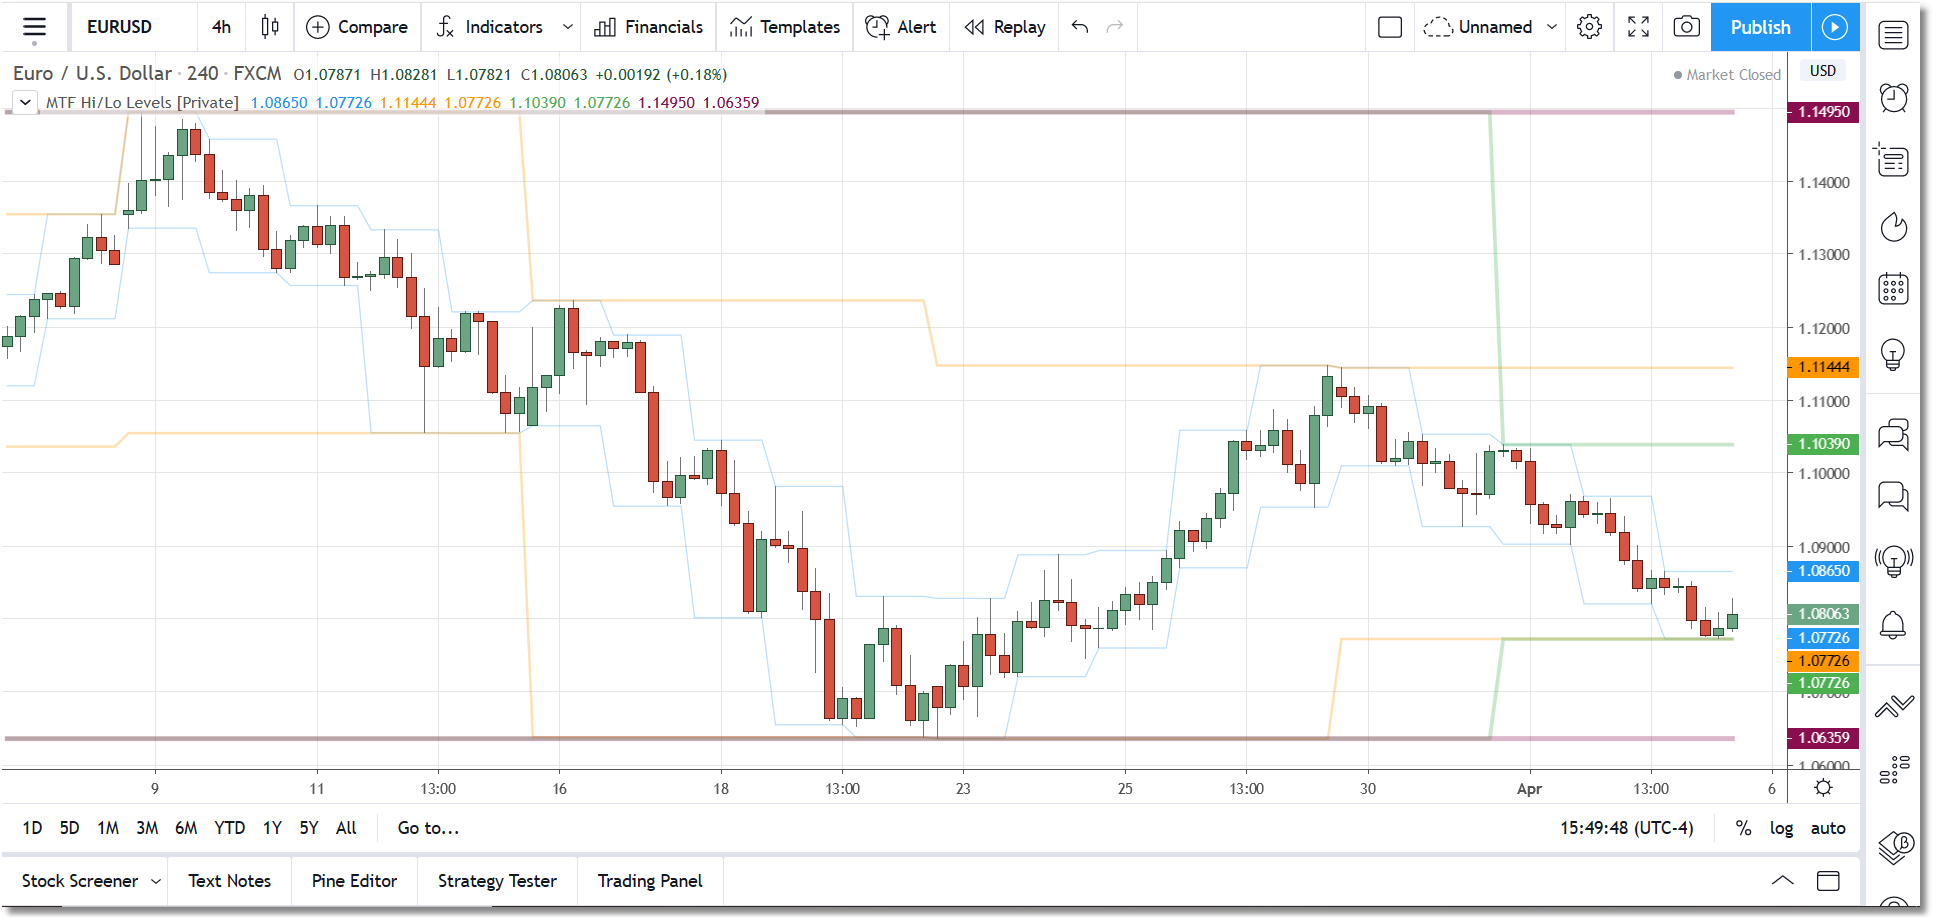
The Multi-Timeframe Hi/Lo Levels indicator for TradingView automatically tracks the Daily, Weekly, Monthly, and Yearly high and low levels and plots them on your chart. This allows to you instantly see where current price is relative to these levels.
You can toggle each timeframe on and off individually or you can allow the indicator to determine when a particular level should be plotted. You can adjust the line colors, thickness, and transparency in the Style section of the Settings dialog. By default we have the lines plotted using relatively high transparency so that they do not distract from the chart action.
It is recommended that you set your TradingView chart scale to Scale Price Chart Only when you use this indicator.
Specifications
- Product ID: TV0014
- Study only, no source code provided
- Requires TradingView
- 14-day trial is available
- All prices are USD, one-time cost
- Payment via PayPal or Credit Card
Multi-Timeframe Moving Average for TradingView
TradingView indicators will automatically be activated for your TradingView account after purchase and no installation is required. Be sure to send us your TradingView Username after you purchase, and remember that the Usernames are case-sensitive.
Description
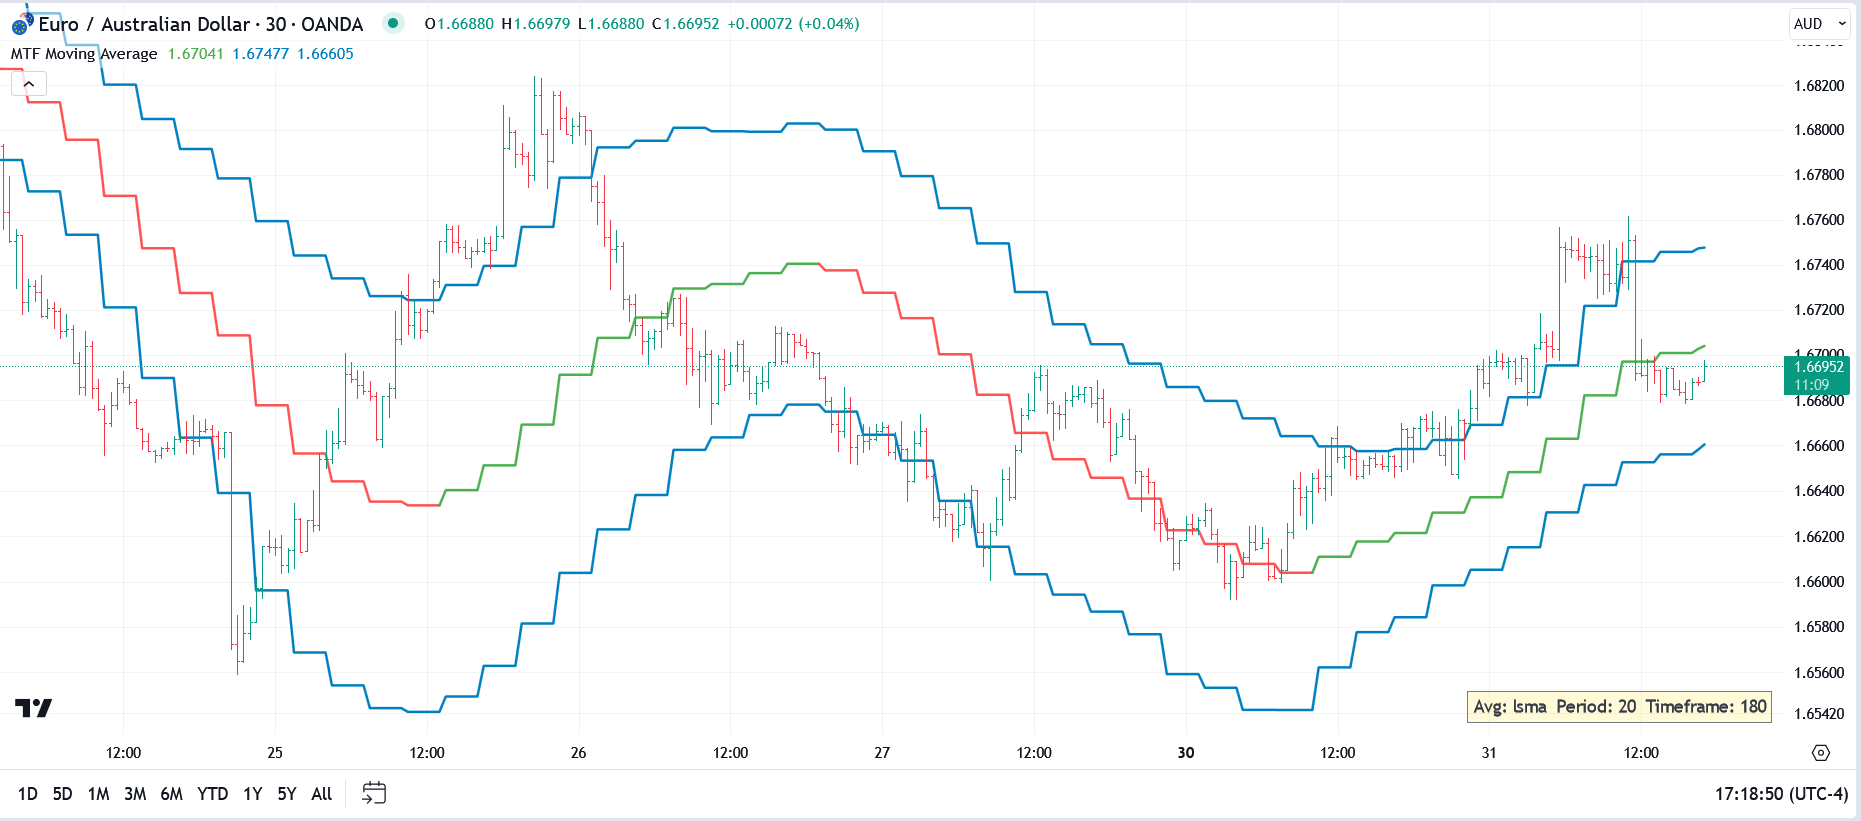
MTF Moving Average is a multi-timeframe moving average indicator. You can use it to plot a user-specified moving average along with an optional set of standard-deviation bands from any timeframe that is >= the chart timeframe.
There are a number of different moving average algorithms to choose from, including sma, ema, hma, smma, svma, triangular, vwma, and a custom low-lag algorithm (vllma).
Specifications
- Product ID: TV0061
- Study only, no source code provided
- Requires TradingView
- 14-day trial is available
- All prices are USD, one-time cost
- Payment via PayPal or Credit Card
Multi-Timeframe Support/Resistance
TradingView indicators will automatically be activated for your TradingView account after purchase and no installation is required. Be sure to send us your TradingView Username after you purchase, and remember that the Usernames are case-sensitive.
Description
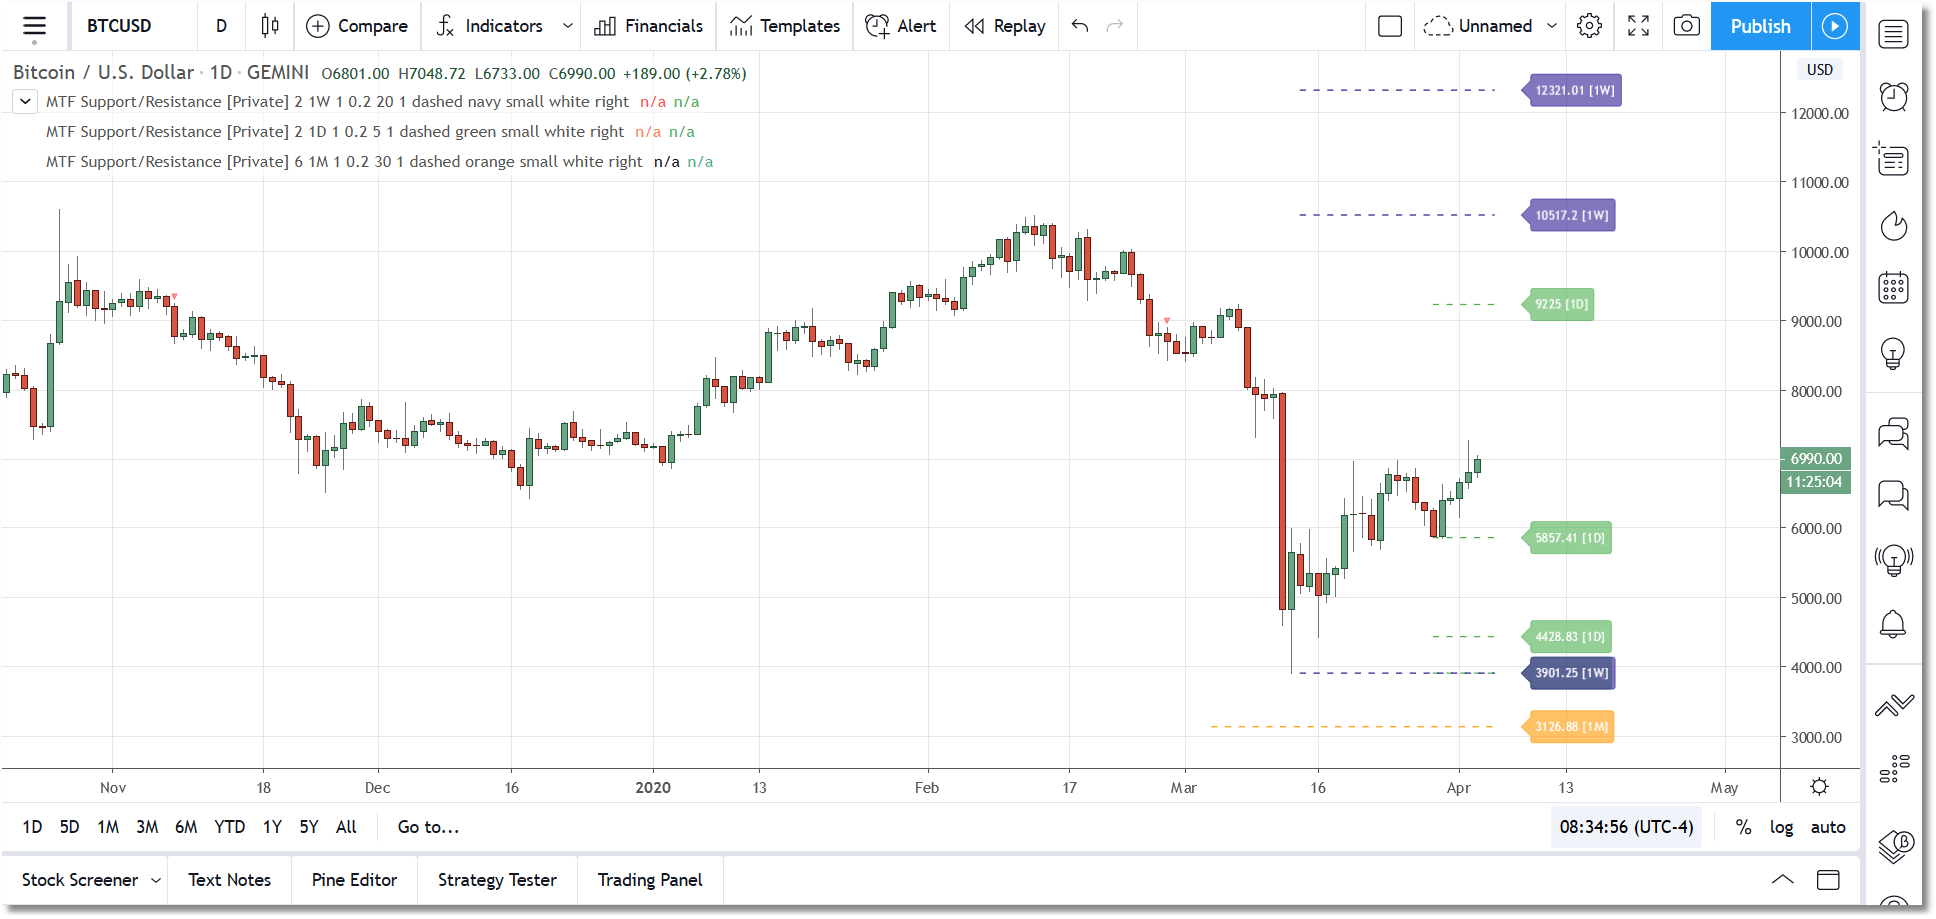
The MTF Support/Resistance indicator for TradingView will track support/resistance levels from a higher timeframe that are in close proximity to the current price action. These are levels where price reversed direction in the past and will likely act as support or resistance in the future. Multiple copies of the indicator can be loaded and each copy can monitor a different timeframe.
MTF Support/Resistance operates in all timeframes supported by TradingView.
In the snapshot on the left we have loaded 3 copies of the indicator to track s/r levels in the Daily, Weekly, and Monthly timeframes.
The indicator will operate in either Auto or Manual mode. In Auto mode it will automatically set the higher timeframe to monitor based on the chart timeframe. In Manual mode, you set the interval to monitor. In either case, you have full control over the strength setting as well as all of the cosmetics. The line style, thickness, length, and color can all be adjusted, and the labels can be positioned either to the left or right of the line (or turned off altogether).
Specifications
- Product ID: TV0011
- Study only, no source code provided
- Requires TradingView
- 14-day trial is available
- All prices are USD, one-time cost
- Payment via PayPal or Credit Card
Multi-Timeframe Trendlines for TradingView
TradingView indicators will automatically be activated for your TradingView account after purchase and no installation is required. Be sure to send us your TradingView Username after you purchase, and remember that the Usernames are case-sensitive.
Description
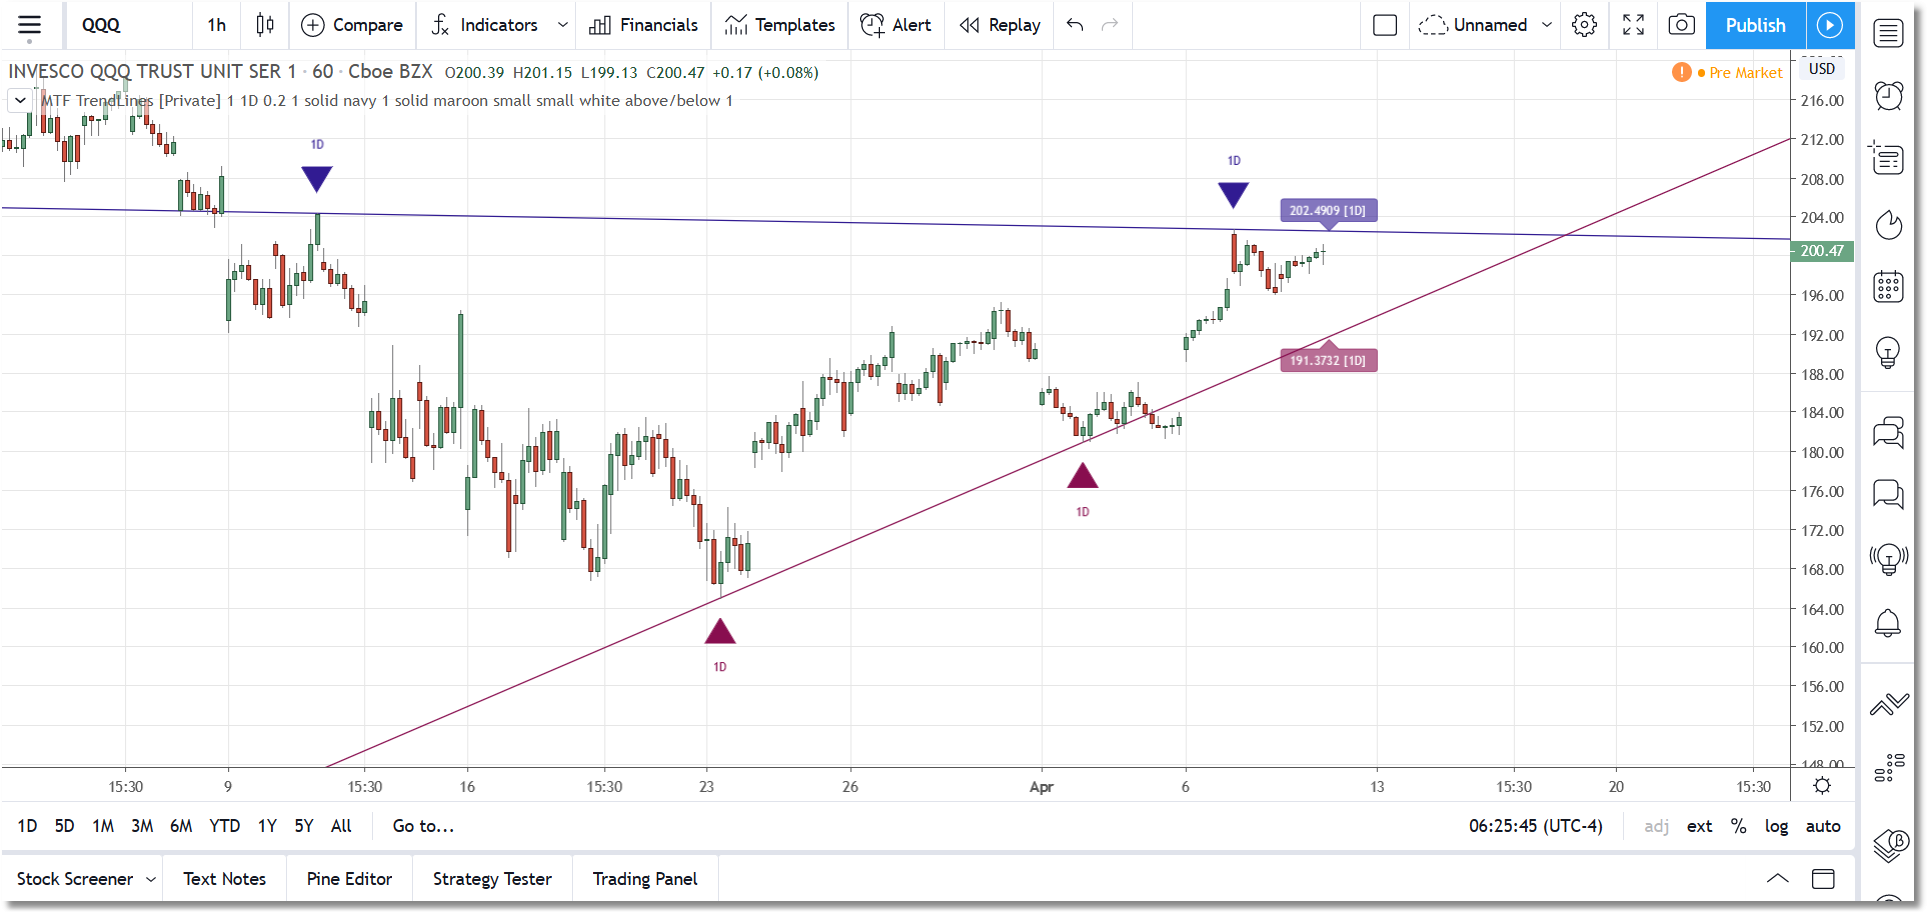
As the name suggests, the Multi-Timeframe Trendlines indicator allows you to extrapolate trendlines from a higher timeframe into your chart timeframe. A maximum of one upper trendline and one lower trendline will be plotted per indicator instance. You can load multiple copies of the indicator into your chart and manually set each copy to operate in a different higher timeframe.
The trendlines are based on the two most recent upper and lower qualifying pivots found in the higher timeframe, and you can adjust the pivot size via the settings menu. In order to qualify, an upper trendline must have a flat to downward slope and a lower trendline must have a flat to upward slope. In both cases there should not be any breach of the trendline between the two pivots. A tolerance factor is provided so you can introduce some leeway in terms of what constitutes a breach.
As mentioned above, the trendlines are actually extrapolated into the chart timeframe. By that we mean that the cluster of bars that comprise each individual pivot in the higher timeframe are located in the chart timeframe, and the bar with the highest-high/lowest-low is used as the actual pivot point. This is necessary because, for example, the high of a daily pivot bar may not always exactly match the highest-high found in the pivot cluster in the chart timeframe.
In terms of selecting the higher timeframe, there are two modes of operation which can be selected via the settings dialog. In Auto Mode the indicator will automatically select the higher timeframe to use based on your chart timeframe. In Manual Mode you select the higher timeframe to use. In either case the selected higher timeframe must always be greater than or equal to the chart timeframe.
Along with each trendline you can also elect to plot pivot markers as well as price labels. Each can be customized and/or toggled on or off via the settings dialog.
The pivot markers will display as up or down triangle shapes plotted below (for lower trendline) or above (for upper trendline) the two price bars that represent the two pivots used in generating the trendline. You have the option to display just the marker, or display the marker plus the timeframe.
The price labels will display on the most current price bar (an offset is provided) and can be configured to display the trendline value as of that bar, the trendline timeframe, or both. You can also adjust the orientation of the price labels.
For the trendlines themselves, you can adjust the color, thickness, and line type. You can also toggle upper and lower trendlines on or off independently. A TradingView alert condition will be set if price breaks through a trendline in realtime.
Specifications
- Product ID: TV0016
- Study only, no source code provided
- Requires TradingView
- 14-day trial is available
- All prices are USD, one-time cost
- Payment via PayPal or Credit Card
Price Action Swing for TradingView
TradingView indicators will automatically be activated for your TradingView account after purchase and no installation is required. Be sure to send us your TradingView Username after you purchase, and remember that the Usernames are case-sensitive.
Description
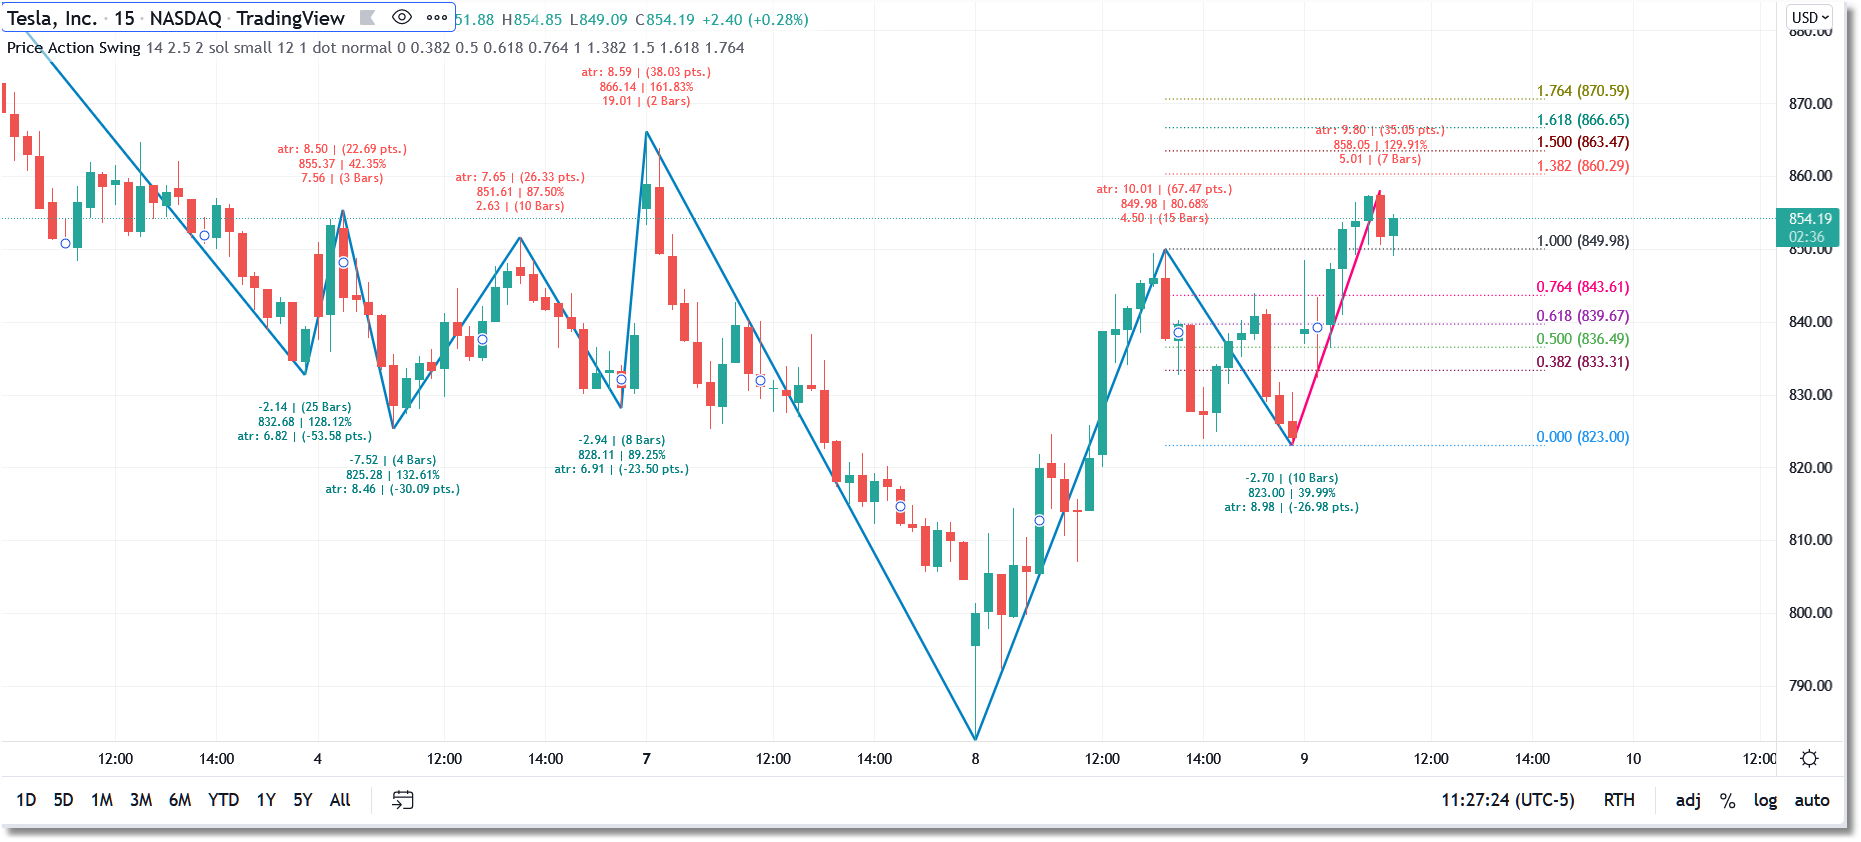
The Price Action Swing for TradingView indicator will track swings based on a degree of movement which you specify using multiples of a user-defined ATR (Average True Range).
The benefit to this approach for swing definition is that the indicator can be used on all securities and on all timeframes with no adjustment required (with a point-based or percent-based swing definition you would typically have to make adjustments to your definition whenever you move between symbols and/or intervals).
In addition to the swings themselves, the indicator will optionally plot a series of swing metrics above/below each swing. These metrics include:
- ATR value on the swing bar
- Point movement in the swing
- Swing price (high/low)
- Swing retracement
- Swing Slope
- Number of bars in Swing
The indicator will also optionally plot a user-defined set of Fibonacci retracement levels overlaying the most current swing.
All cosmetics can be adjusted via the script menu, and all components can be toggled on/off.
Specifications
- Product ID: TV0020
- Study only, no source code provided
- Requires TradingView
- 14-day trial is available
- All prices are USD, one-time cost
- Payment via PayPal or Credit Card
RSI Divergence for TradingView
TradingView indicators will automatically be activated for your TradingView account after purchase and no installation is required. Be sure to send us your TradingView Username after you purchase, and remember that the Usernames are case-sensitive.
Description
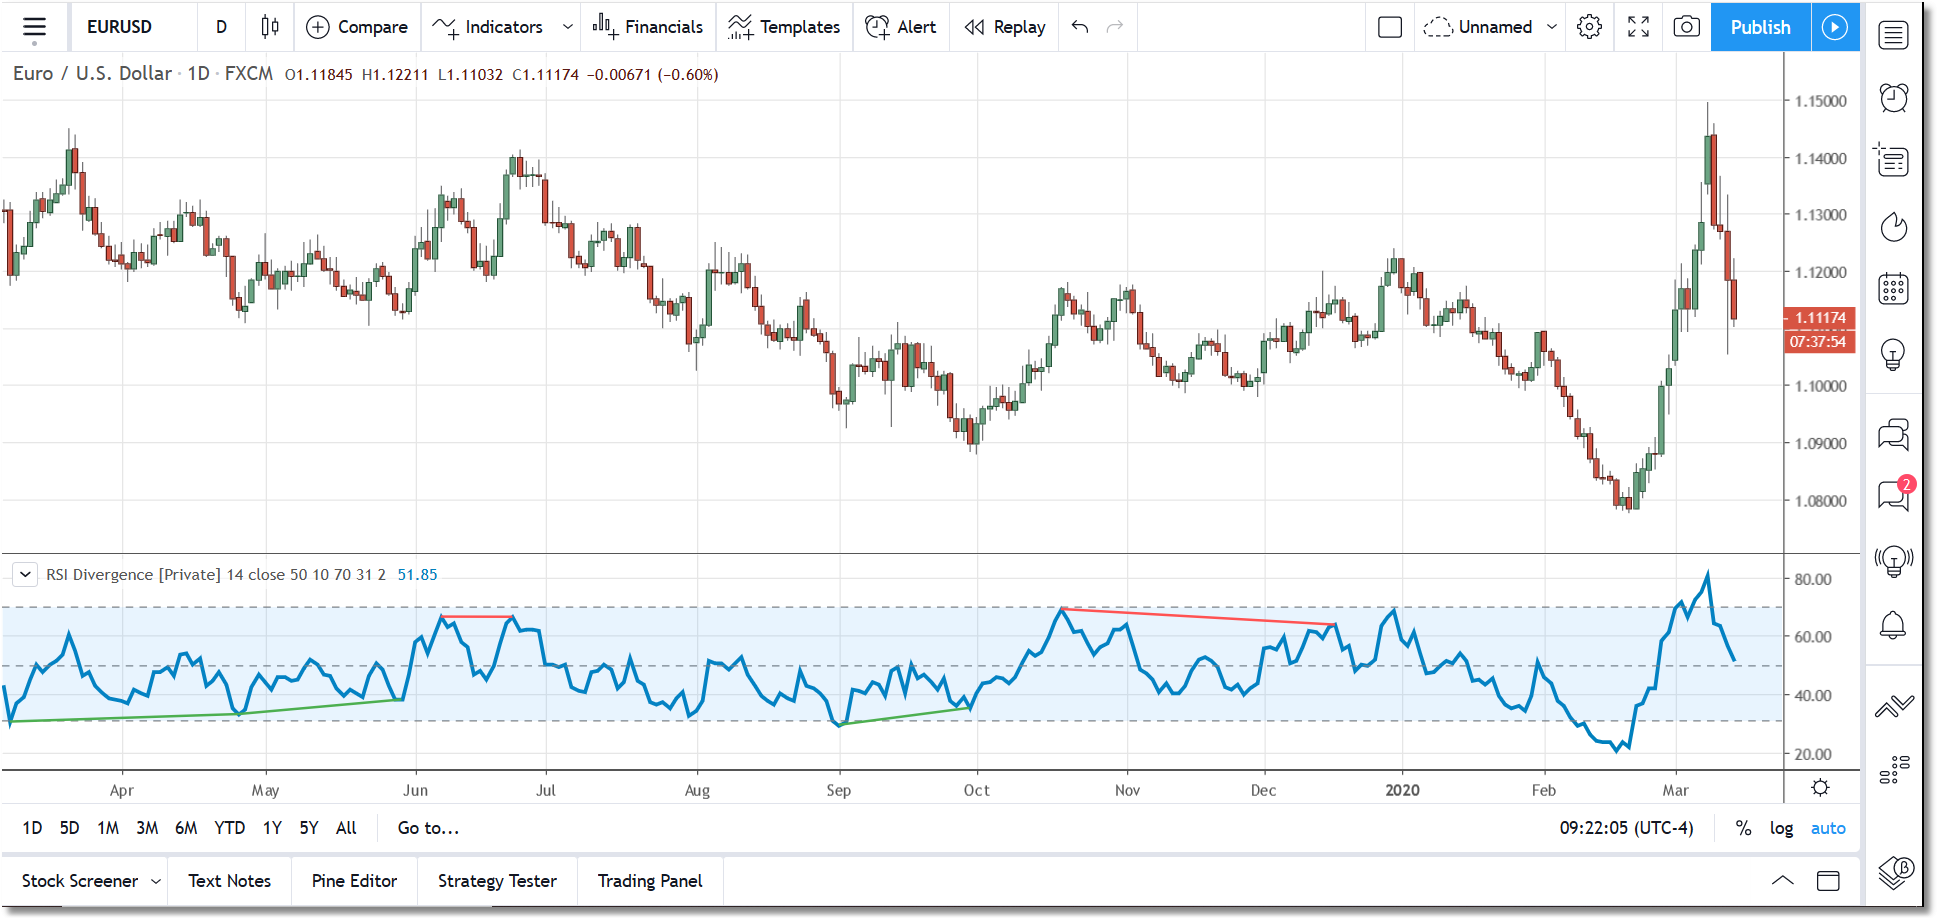
This indicator will identify divergences between price action and the RSI. A very thorough algorithm is used and it will accurately detect and/or extend all divergences. When the indicator is first loaded, it will mark all divergences found in the historical data and it will check for divergences as each new bar arrives in realtime. Several parameters are available to fine-tune the indicator operation. Alerts are included.
Specifications
- Product ID: TV0004
- Study only, no source code provided
- Requires TradingView
- 14-day trial is available
- All prices are USD, one-time cost
- Payment via PayPal or Credit Card
S/R Trendlines for TradingView
TradingView indicators will automatically be activated for your TradingView account after purchase and no installation is required. Be sure to send us your TradingView Username after you purchase, and remember that the Usernames are case-sensitive.
Description
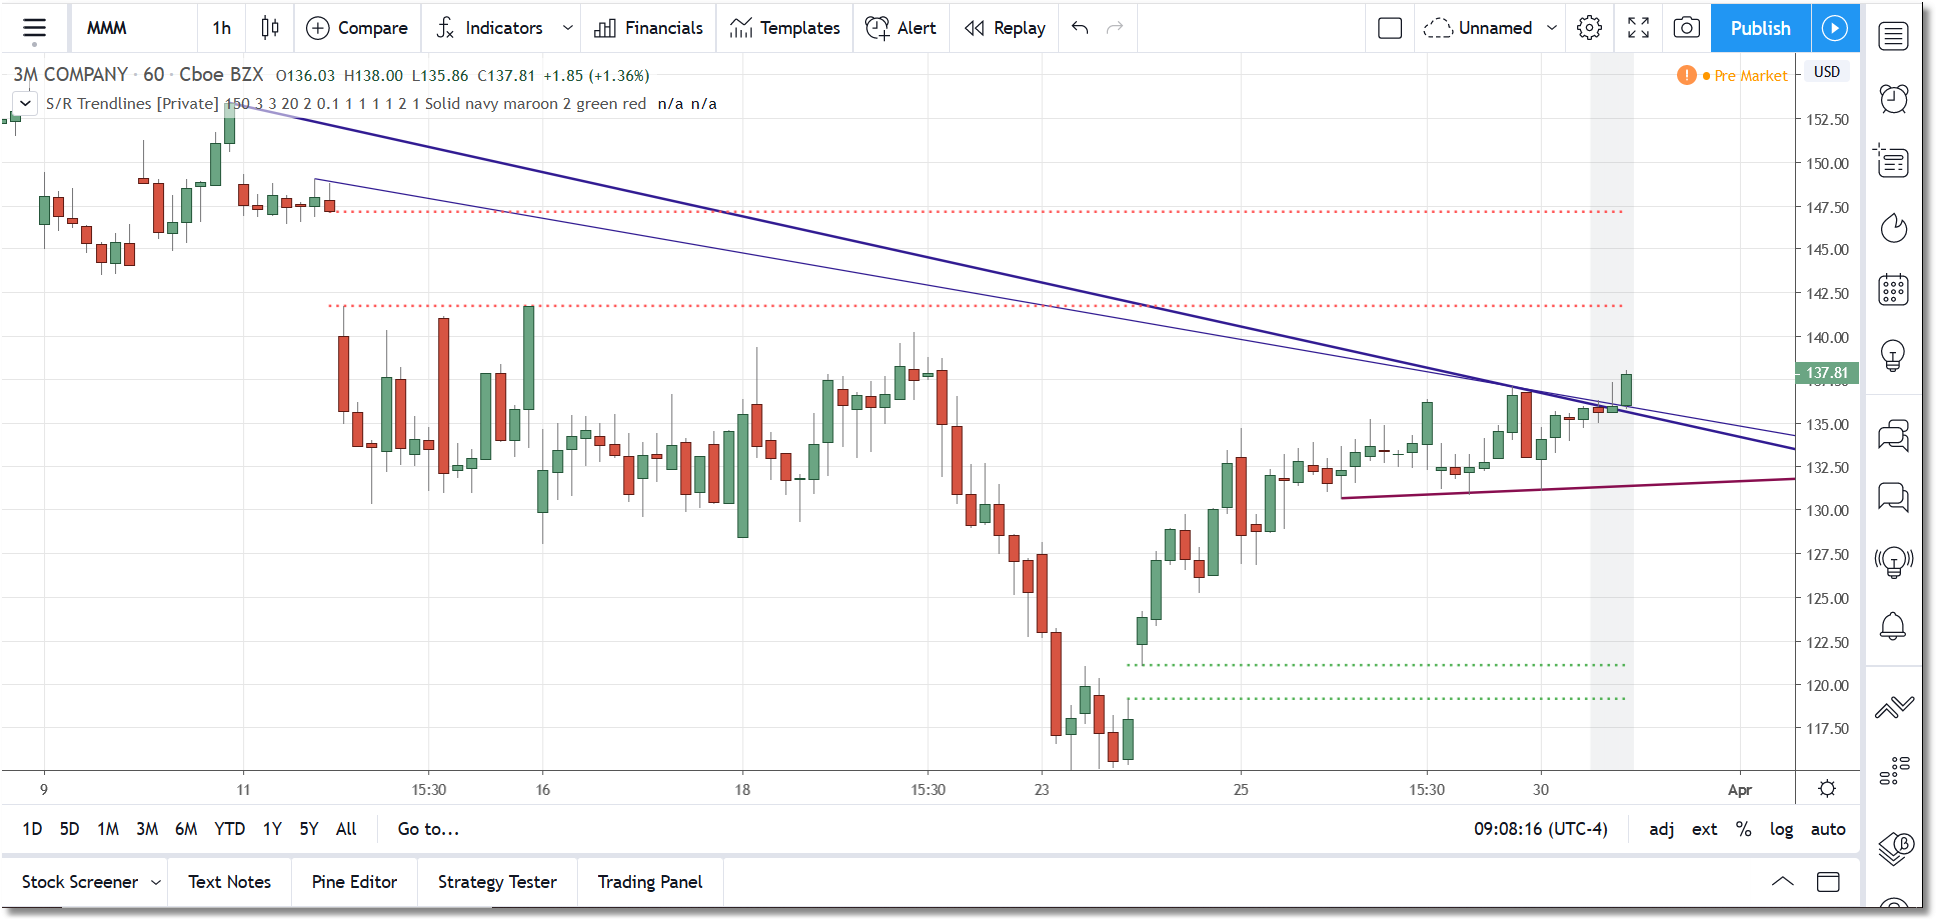
This is a TradingView adaptation of our flagship S/R Analyst Pro support/resistance indicator. S/R Trendlines will automatically calculate and plot up to three upper and three lower trendlines based on pivots in the price data. The trendlines are ranked by a series of weightings (see below) and the highest-ranking trendline is always displayed as a thicker line.
You can specify the lookback, pivot size, minimum trendline length, minimum required touchpoints, a tolerance factor, and a series of user-defined weightings (i.e., touchpoint, length, gap, and proximity) that will allow you to control the characteristics of the trendlines identified by the software. The cosmetics are fully customizable as well.
S/R Trendlines will also identify and highlight the two most recent active gaps in the price data (i.e. Gap Up or Gap Down situations). Recent gaps tend to act as price magnets, particularly in stocks and futures, so this is a very useful feature. And, finally, S/R Trendlines will identify and highlight up to 4 support/resistance levels in the price action. These are displayed as dashed lines and the strength of each s/r level is displayed to the right of each line. You can specify the minimum required strength as well as a tolerance factor to be used specifically for support/resistance level checking.
User Guide should be ready in a few days.
Specifications
- Product ID: TV0010
- Study only, no source code provided
- Requires TradingView
- 14-day trial is available
- All prices are USD, one-time cost
- Payment via PayPal or Credit Card
Shannon Entropy for TradingView
TradingView indicators will automatically be activated for your TradingView account after purchase and no installation is required. Be sure to send us your TradingView Username after you purchase, and remember that the Usernames are case-sensitive.
Description
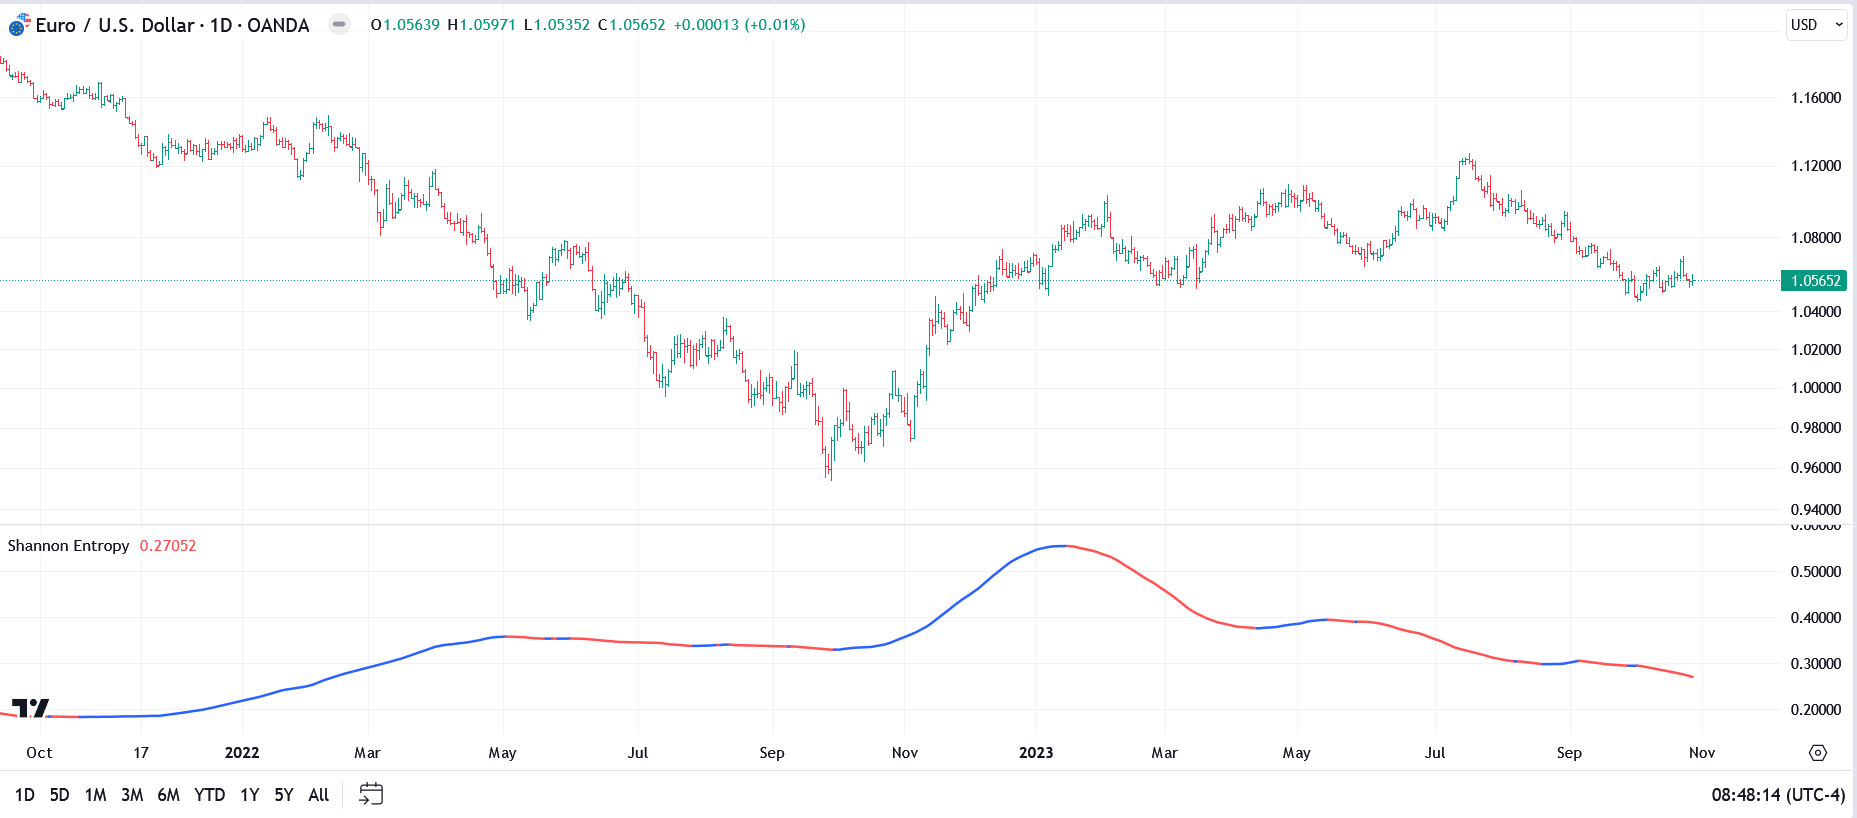
The Shannon Entropy algorithm provides a measure of the randomness or unpredictability in a financial time series. It operates by first converting the price series into a series of returns, calculating the difference between consecutive prices, and then normalizing these values to obtain a standardized measure of price movements. The standardized returns are then discretized into a predefined number of bins, creating a distribution that represents the frequency of different return levels.
The Shannon Entropy itself is calculated using this distribution. For each bin, the algorithm calculates the probability of a return falling into that bin based on the frequency of occurrence. These probabilities are then used to compute the entropy value, following Shannon???s formula. The result is a single number that quantifies the level of disorder in the return series...a higher entropy value indicates a more unpredictable series, while a lower value suggests a more predictable pattern. The values are normalized and will plot in a range between 0 and 1. By default the values are averaged as well to provide a smoother view and you can adjust the average period.
This methodology provides several benefits for analyzing financial time series. By quantifying the unpredictability of price movements, traders and analysts can use Shannon Entropy as a tool to assess market conditions and make more informed trading decisions.
A sudden increase in entropy might signal a transition to a more volatile and unpredictable market, prompting a reevaluation of existing trading strategies. Conversely, a decrease in entropy might indicate a trending market, potentially providing opportunities for trend-following strategies. Additionally, by analyzing entropy over time, one can gain insights into the changing nature of market efficiency, helping to identify periods where price movements are more or less influenced by random noise. This information can be crucial for adapting trading strategies to current market conditions, managing risk, and improving overall trading performance.
You might consider loading 2 or 3 copies of the indicator and setting each to a different window size to monitor the value on a short, intermediate, and long-term basis. Suggested window size values would be 20, 50, and 100 respectively. If all are low or all are falling the price series is becoming more 'predictable'. And if all are high or rising the series is becoming more volatile.
The Shannon Entropy indicator can be used in conjunction with our mesaForecaster to help gauge the best times to produce a forecast.
Specifications
- Product ID: TV0059
- Study only, no source code provided
- Requires TradingView
- 14-day trial is available
- All prices are USD, one-time cost
- Payment via PayPal or Credit Card
Stochastic Divergence for TradingView
TradingView indicators will automatically be activated for your TradingView account after purchase and no installation is required. Be sure to send us your TradingView Username after you purchase, and remember that the Usernames are case-sensitive.
Description
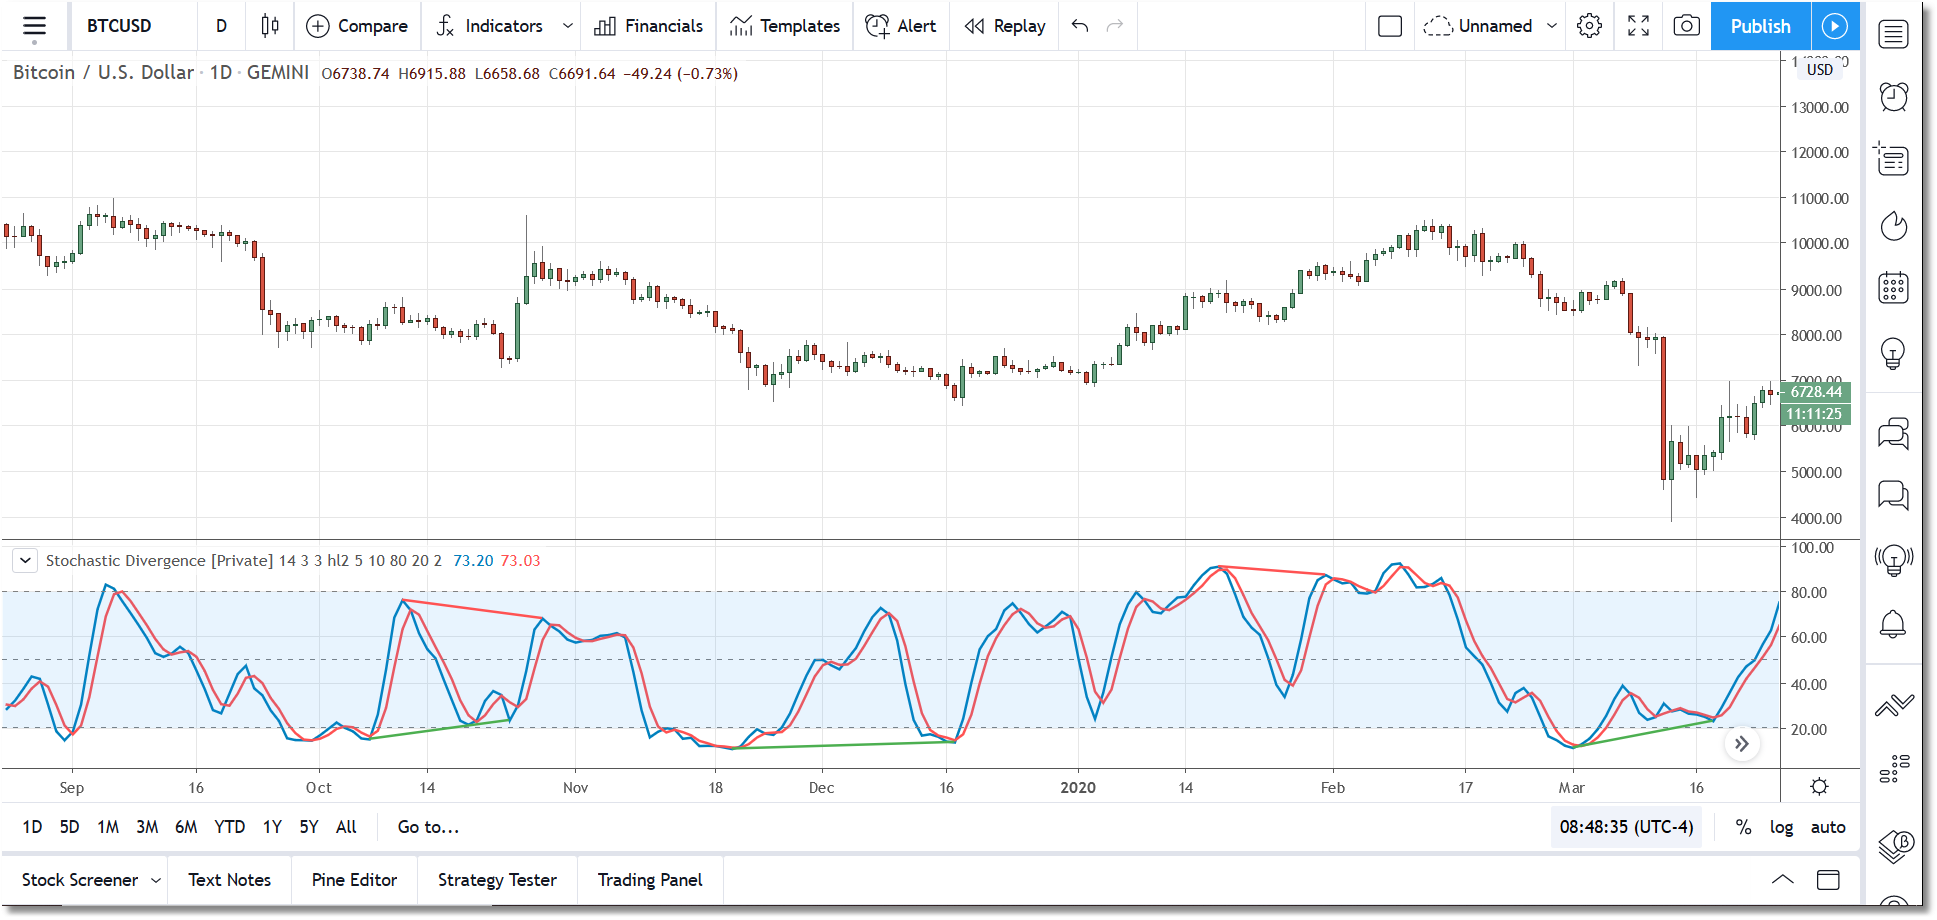
This indicator will identify divergences between price action and the Stochastic %K or %D. A very thorough algorithm is used and it will accurately detect and/or extend all divergences. When the indicator is first loaded, it will mark all divergences found in the historical data and it will check for divergences as each new bar arrives in realtime. Several parameters are available to fine-tune the indicator operation. Alerts are included.
Specifications
- Product ID: TV0013
- Study only, no source code provided
- Requires TradingView
- 14-day trial is available
- All prices are USD, one-time cost
- Payment via PayPal or Credit Card
Stochastic TrendDetect for TradingView
TradingView indicators will automatically be activated for your TradingView account after purchase and no installation is required. Be sure to send us your TradingView Username after you purchase, and remember that the Usernames are case-sensitive.
Description
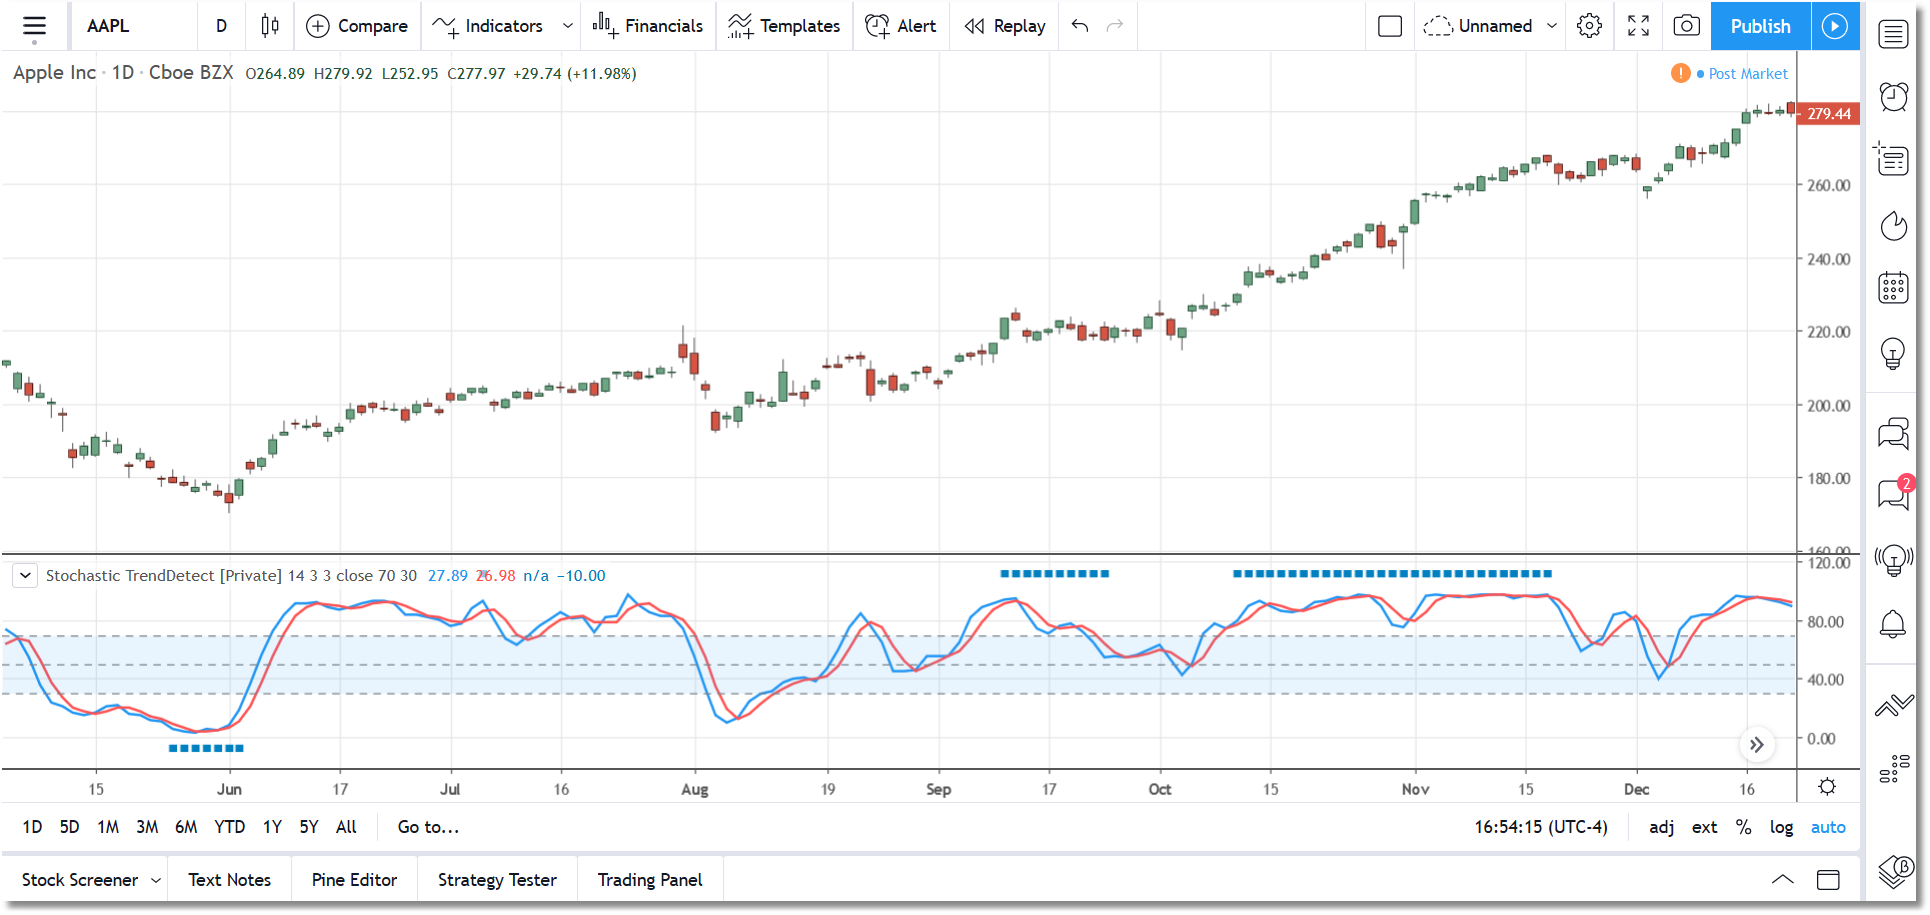
Calculates and plots the standard stochastics (%K and %D). It also incorporates an adaptive trend-detection feature that operates in a fashion similar to the GET False Bar Stochastic.
A band will be plotted above the stochastic plot if bullish trend continuation is expected, and a band will be plotted below the stochastic plot if bearish trend continuation is expected. These bands should be used as filters for the stochastic signals. So, in general, if a band is present below the stochastic plot then you should favor short signals (down-trend is expected to continue) and if a band is present above the stochastic plot then you should favor long signals (up-trend is expected to continue).
TradingView alert conditions will be generated whenever a new false bar signal is generated.
Specifications
- Product ID: TV0007
- Study only, no source code provided
- Requires TradingView
- 14-day trial is available
- All prices are USD, one-time cost
- Payment via PayPal or Credit Card
Tech Reversion System for TradingView
TradingView indicators will automatically be activated for your TradingView account after purchase and no installation is required. Be sure to send us your TradingView Username after you purchase, and remember that the Usernames are case-sensitive.
Description
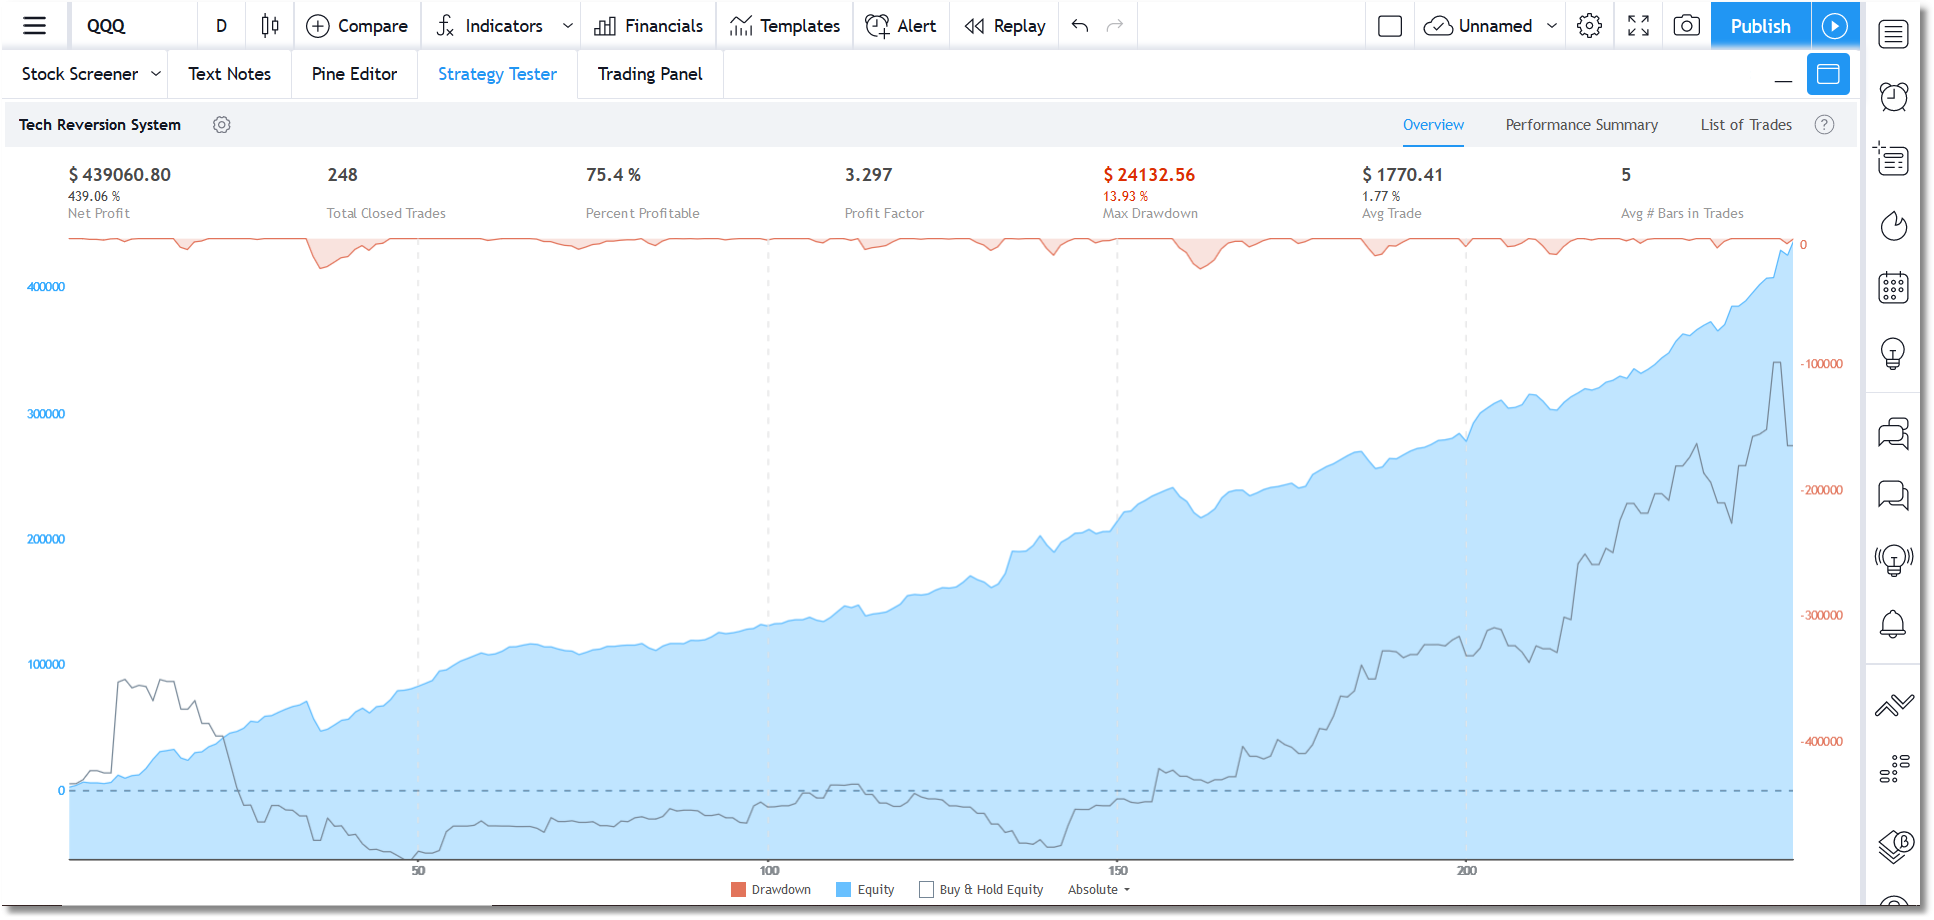
This is a mean reversion system developed specifically for the QQQ ETF , and is designed to run in the Daily interval. It is a Long-Only system.
The goal was to develop a system that could beat the buy-and-hold returns with lower drawdowns and less time in the market. This system does that quite well. Assuming the default settings ($100K initial capital, 50% equity investment, and up to 2 add-on pyramid trades) it achieved a 75% win rate, a 3.29 profit factor, around 30% annual return, around 20% max drawdown, and a time-in-market of less than 12% when backtested from 1999 to present.
The backtest assumed a 0.05 per share commission with 2 tick slippage.
The system allows the user to control the trigger threshold (how sensitive it is to signals) and includes a Momentum filter and a Volatility filter that can be toggled on/off.
On average the system generates 6 or 7 trades per year (average trade lasts 4 days), and all entries and scheduled exits are at market open the session after the signal is generated. The stop is fairly large and is intended only as a fail-safe in the event of a market event.
While developed specifically for the QQQ, it can also be used with technology stocks and other tech-based funds (i.e., AMZN, INTC, etc.).
Specifications
- Product ID: TV0018
- Study only, no source code provided
- Requires TradingView
- 14-day trial is available
- All prices are USD, one-time cost
- Payment via PayPal or Credit Card
Time Series Decomposition for TradingView
TradingView indicators will automatically be activated for your TradingView account after purchase and no installation is required. Be sure to send us your TradingView Username after you purchase, and remember that the Usernames are case-sensitive.
Description
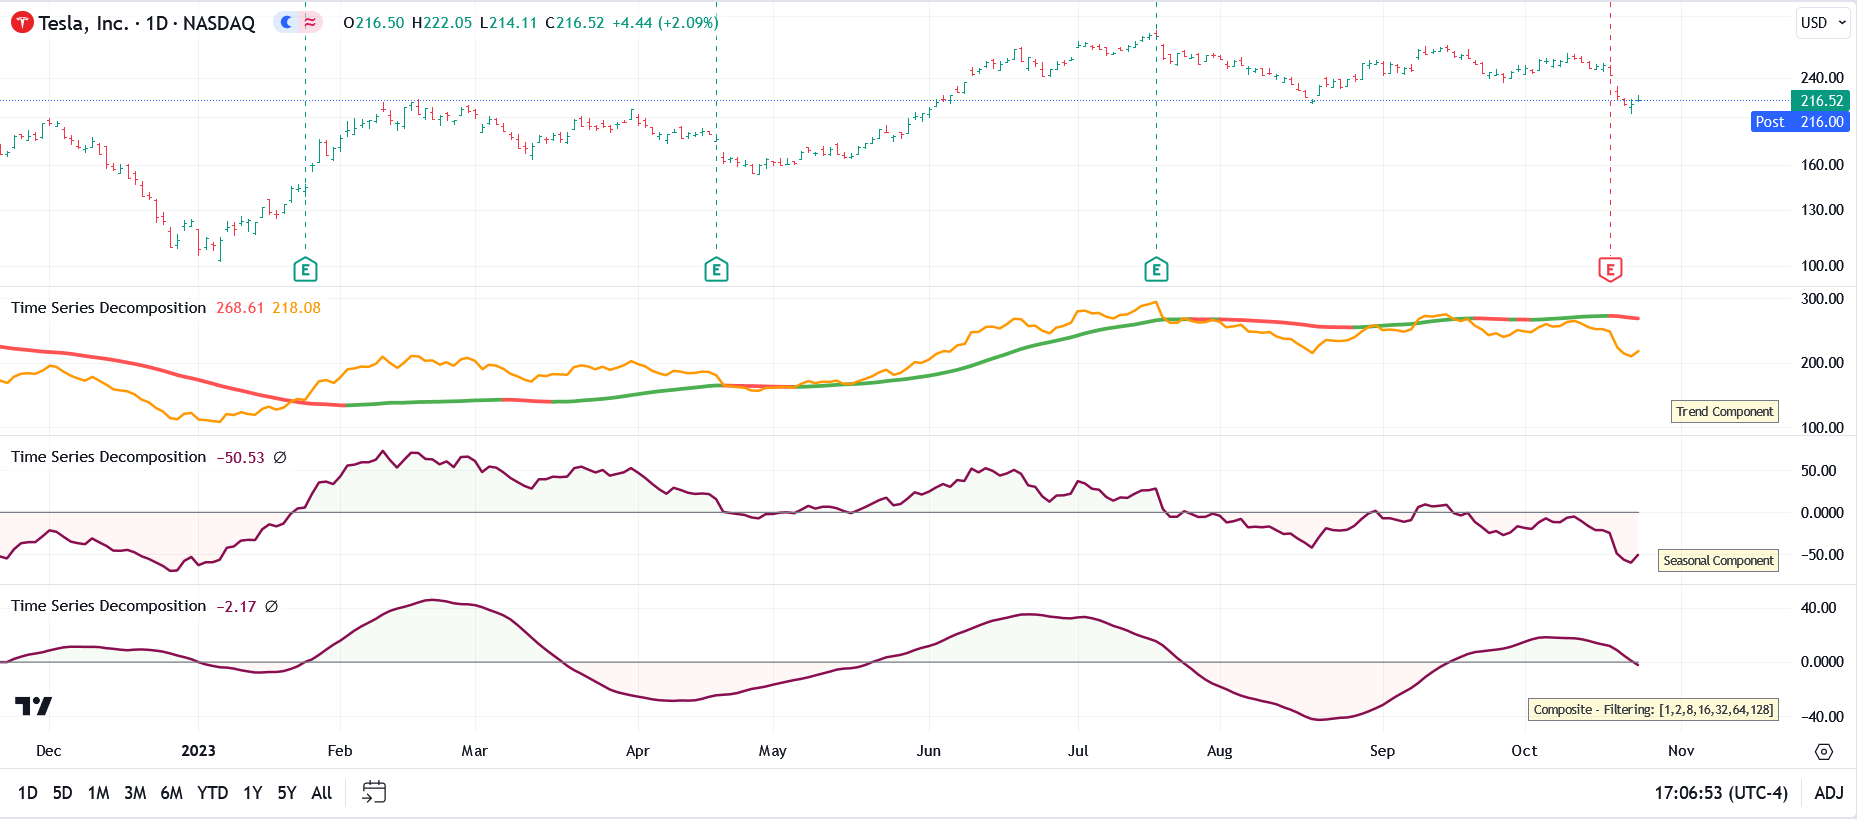
The Time Series Decomposition indicator uses wavelet technology (specifically a Haar wavelet forward and inverse transform) to separate the selected time series into its component parts.
The Haar wavelet transform breaks down information into two parts:
1. Averages: A smoothed-out, general view.2. Differences: How each piece of data deviates from that smooth view.
When you apply the Haar wavelet transform repeatedly, you further break down those averages into more averages and differences, again and again, until you reach a level of detail you're satisfied with.
Financial data, like stock prices, can be thought of as having multiple layers:
1. Trend: The general direction in which a stock is moving over a long period.2. Seasonality: Regular ups and downs that happen due to known events, like earnings announcements.
3. Noise or Residuals: Random fluctuations that can't be easily attributed to any known factor.
Using the Haar wavelet transform, we can separate stock price data into these layers:
- The coarsest (broadest) averages show us the trend.- The mid-level details serve to highlight seasonality.
- The finest level details (and differences) often represent noise.
By analyzing these components separately, we can:
1. Filter Out Noise: To make predictions or understand the real movement without daily fluctuations.2. Detect Patterns: By focusing on seasonality, one might detect patterns related to specific events.
3. Event Detection: Sudden spikes in the finest details could indicate market reactions to unforeseen events.
By understanding each layer, you can make more informed decisions about investments, trading strategies, and risk management.
In the Time Series Decomposition indicator, all of this is automated. In the indicator menu you can select from:
Trend Component: This would be the coarsest level of the data (the last few coefficients from the transformed data) and these coefficients represent the low-frequency components (i.e., the long-term trend)Seasonal Component: This would be the middle-level coefficients and they represent fluctuations in the data that aren't as fast as noise but aren't as slow as trends.
Residual Component: The finest scale, or the first few coefficients from the transformed data, would represent the high-frequency noise.
Composite: This is a custom transform that allows you to filter out specific components to create a customized view of the data. The sets of coefficients that can be filtered out are 1,2,4,8,16,32,64 and 128. The lowest frequency components are represented in coefficient set 1 while the highest-frequency components are represented in coefficient set 128.
Specifications
- Product ID: TV0052
- Study only, no source code provided
- Requires TradingView
- 14-day trial is available
- All prices are USD, one-time cost
- Payment via PayPal or Credit Card
Triangle Pattern for TradingView
TradingView indicators will automatically be activated for your TradingView account after purchase and no installation is required. Be sure to send us your TradingView Username after you purchase, and remember that the Usernames are case-sensitive.
Description
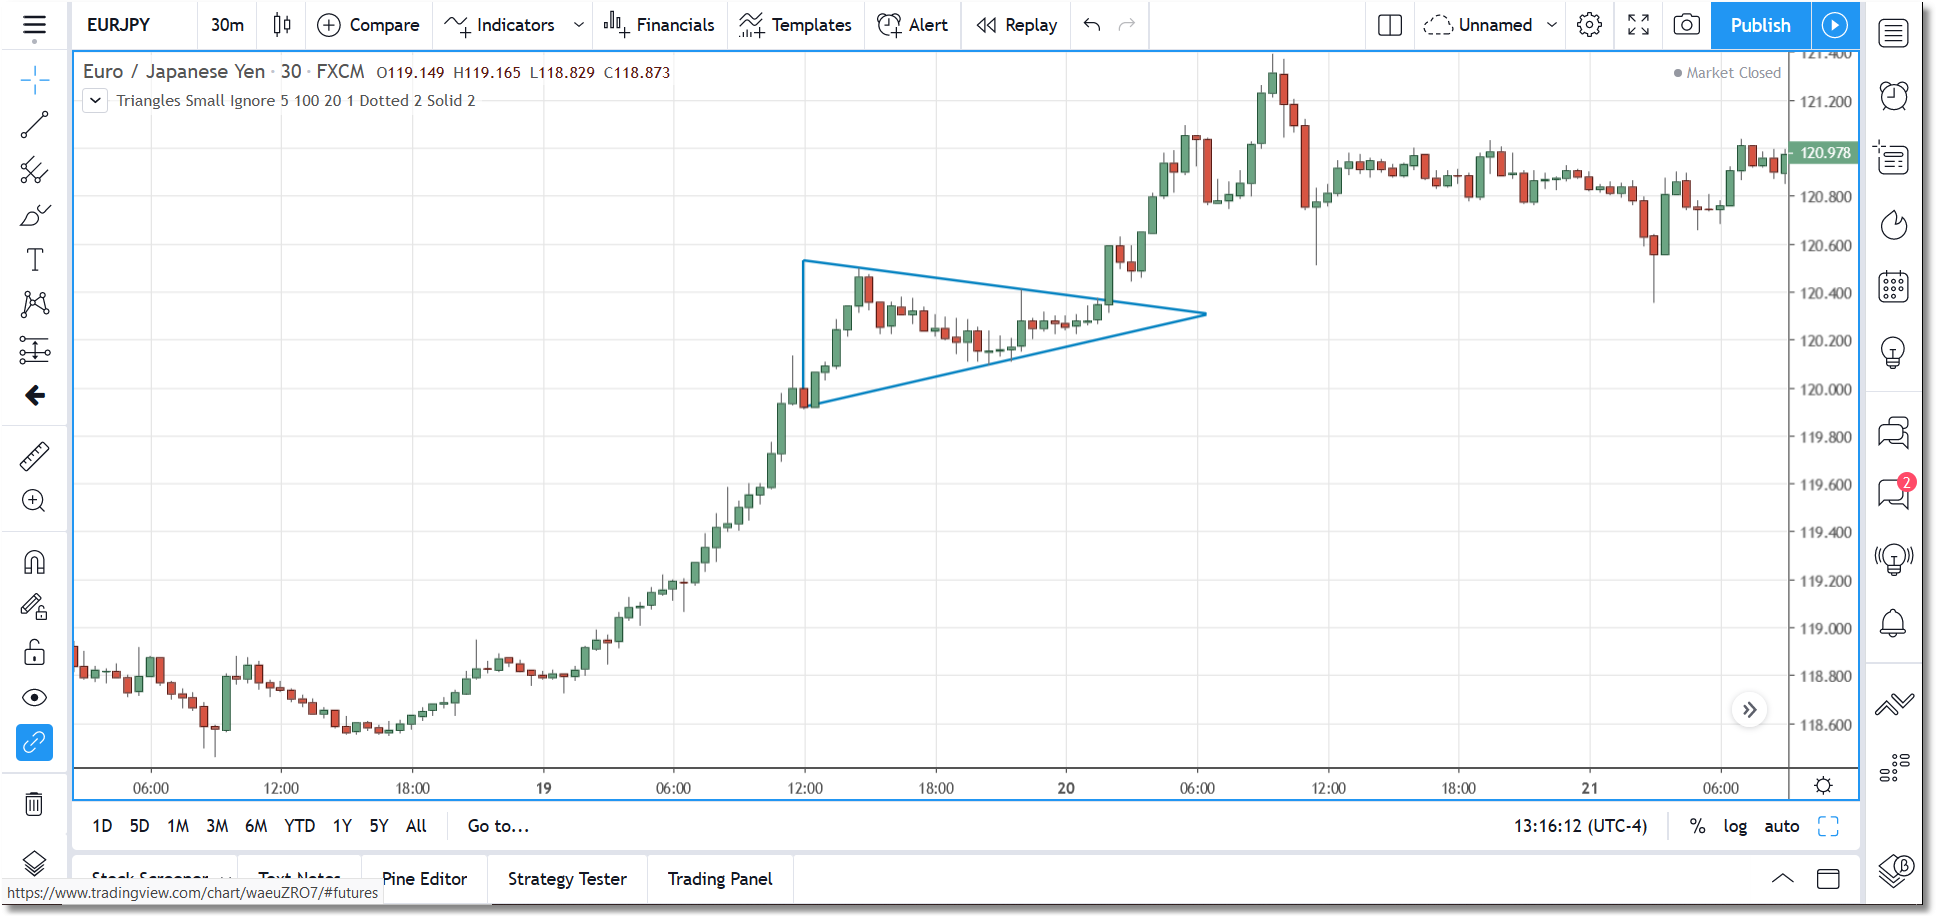
This TradingView indicator will identify and plot pending and confirmed triangle patterns (i.e., Ascending, Descending, and Common) based on settings and filters that you define via the menu interface, and it will generate alerts whenever these patterns are found. Provide your TradingView Username at time of purchase.
Click on the More Info button below to access the User Guide.
Specifications
- Product ID: TV0002
- Study only, no source code provided
- Requires TradingView
- 14-day trial is available
- All prices are USD, one-time cost
- Payment via PayPal or Credit Card
VWAP Bands for TradingView
TradingView indicators will automatically be activated for your TradingView account after purchase and no installation is required. Be sure to send us your TradingView Username after you purchase, and remember that the Usernames are case-sensitive.
Description
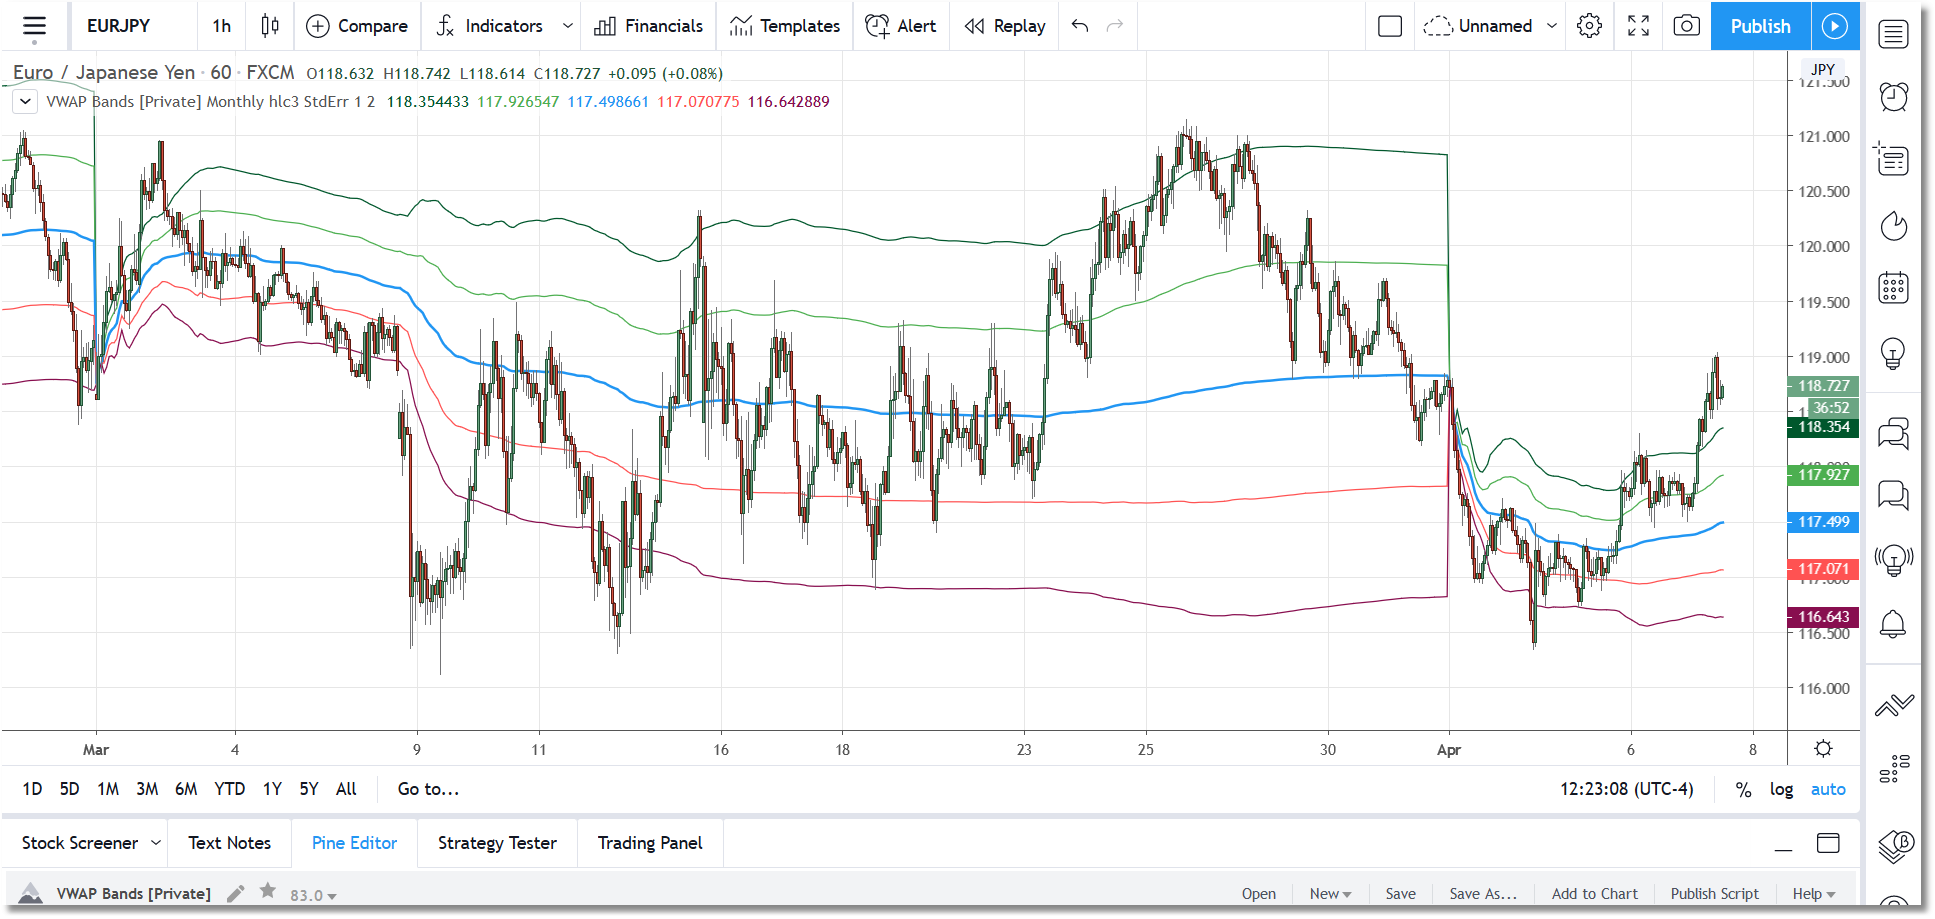
The VWAP Bands for TradingView indicator will calculate and plot the Volume Weighted Average Price (VWAP) in either the Daily, Weekly, or Monthly session. It will also plot up to two sets of deviation bands that are cumulative based on the selected session. For the deviation bands, you can select from Standard Deviation or Standard Error for the calculation logic.
In the settings dialog, you can adjust the session, price source, deviation calculation, and set the number of deviations to use for each set of bands. Each set of bands can be toggled on/off individually.
While, as mentioned above, you can adjust the session setting, the indicator will automatically select the most appropriate session if you move into a chart interval that does not support the currently defined session.
Specifications
- Product ID: TV0015
- Study only, no source code provided
- Requires TradingView
- 14-day trial is available
- All prices are USD, one-time cost
- Payment via PayPal or Credit Card