divergence software, inc.
Development & Consulting Services
Product Detail
Shannon Entropy for TradingView

TradingView indicators will be activated for your TradingView account and no installation is required. eSignal indicators will be delivered to you via email in zip files. Some of the more complex indicators have installer programs. In most cases we will require your eSignal username so that we can set up the entitlement for the indicator(s) you have purchased.
The majority of our indicators are licensed for a one-time fee (i.e., non-recurring). However, we do have some subscription-based products, including marketDirection Monitor, Harmonic Pattern Collection, and S/R Analyst Pro.
Description
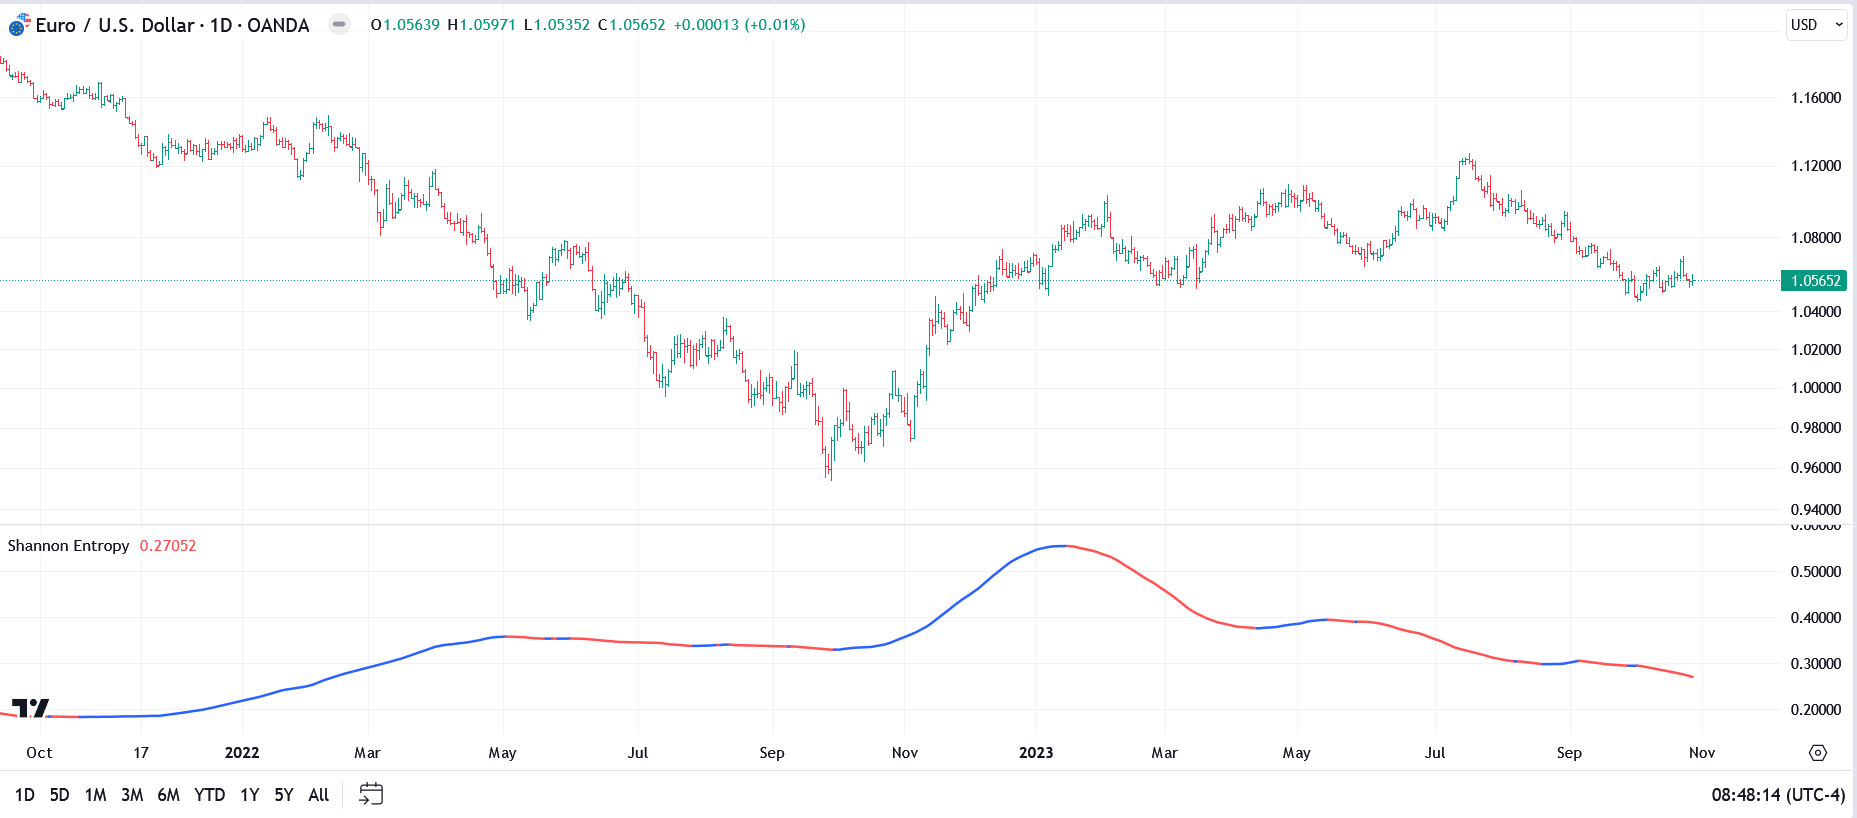
The Shannon Entropy algorithm provides a measure of the randomness or unpredictability in a financial time series. It operates by first converting the price series into a series of returns, calculating the difference between consecutive prices, and then normalizing these values to obtain a standardized measure of price movements. The standardized returns are then discretized into a predefined number of bins, creating a distribution that represents the frequency of different return levels.
The Shannon Entropy itself is calculated using this distribution. For each bin, the algorithm calculates the probability of a return falling into that bin based on the frequency of occurrence. These probabilities are then used to compute the entropy value, following Shannon???s formula. The result is a single number that quantifies the level of disorder in the return series...a higher entropy value indicates a more unpredictable series, while a lower value suggests a more predictable pattern. The values are normalized and will plot in a range between 0 and 1. By default the values are averaged as well to provide a smoother view and you can adjust the average period.
This methodology provides several benefits for analyzing financial time series. By quantifying the unpredictability of price movements, traders and analysts can use Shannon Entropy as a tool to assess market conditions and make more informed trading decisions.
A sudden increase in entropy might signal a transition to a more volatile and unpredictable market, prompting a reevaluation of existing trading strategies. Conversely, a decrease in entropy might indicate a trending market, potentially providing opportunities for trend-following strategies. Additionally, by analyzing entropy over time, one can gain insights into the changing nature of market efficiency, helping to identify periods where price movements are more or less influenced by random noise. This information can be crucial for adapting trading strategies to current market conditions, managing risk, and improving overall trading performance.
You might consider loading 2 or 3 copies of the indicator and setting each to a different window size to monitor the value on a short, intermediate, and long-term basis. Suggested window size values would be 20, 50, and 100 respectively. If all are low or all are falling the price series is becoming more 'predictable'. And if all are high or rising the series is becoming more volatile.
The Shannon Entropy indicator can be used in conjunction with our mesaForecaster to help gauge the best times to produce a forecast.
Specifications
- Product ID: TV0059
- Study only, no source code provided
- Requires TradingView