divergence software, inc.
Development & Consulting Services
Product Detail
TradeFlow - Activity

TradingView indicators will be activated for your TradingView account and no installation is required. eSignal indicators will be delivered to you via email in zip files. Some of the more complex indicators have installer programs. In most cases we will require your eSignal username so that we can set up the entitlement for the indicator(s) you have purchased.
The majority of our indicators are licensed for a one-time fee (i.e., non-recurring). However, we do have some subscription-based products, including marketDirection Monitor, Harmonic Pattern Collection, and S/R Analyst Pro.
Description
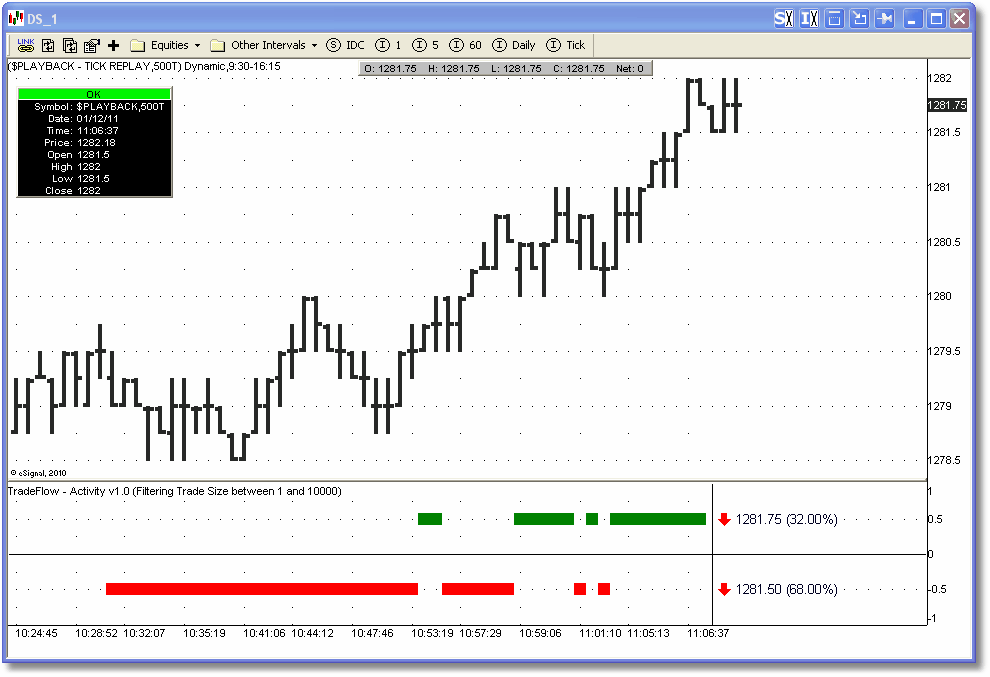
The TradeFlow-Activity indicator provides a visual cue on current buying and selling activity. You define a share-size group to monitor and the indicator will graphically track the buying and selling over the most recent 50 to 200 trades within that share-size group. A trade that represents buying/covering is plotted as a green square in the upper half of the indicator while a trade that represents selling/shorting is plotted as a red square in the lower half of the indicator. On the right-hand side of the indicator the current ask and bid prices are displayed along with a percentage value that represents the ratio of buying to selling and vice-versa. An up or down arrow is also displayed near the bid and ask prices indicating the direction of the last change in price.
Specifications
- Product ID: TFL01
- Study only, no source code provided
- Requires eSignal 12.x or newer