divergence software, inc.
Development & Consulting Services
Product Detail
MESA Spectrum Analysis
TradingView indicators will be activated for your TradingView account and no installation is required. eSignal indicators will be delivered to you via email in zip files. Some of the more complex indicators have installer programs. In most cases we will require your eSignal username so that we can set up the entitlement for the indicator(s) you have purchased.
The majority of our indicators are licensed for a one-time fee (i.e., non-recurring). However, we do have some subscription-based products, including marketDirection Monitor, Harmonic Pattern Collection, and S/R Analyst Pro.
Description
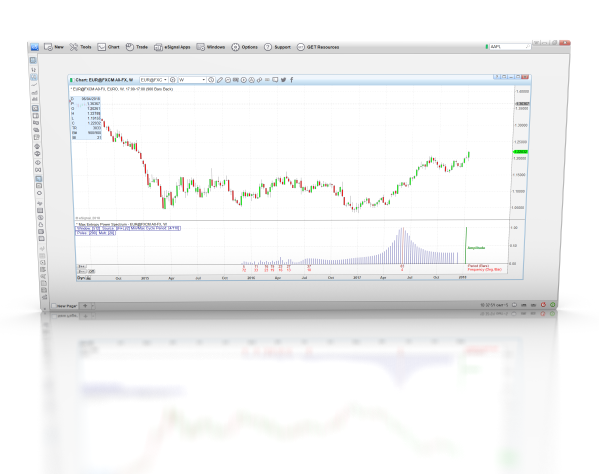
This script calculates and displays a power spectrum using Maximum Entropy Spectral Analysis (MESA). This power spectrum is arguably the most powerful of the three power spectrum versions we offer. While it is not as accurate as the Lomb formula when dealing with unevenly sampled data series, the MESA calculation is more robust than either FFT or Lomb because, by its design, you can adjust the granularity and density of the spectral analysis which makes it easy to 'fine tune' the spectrum display to bring the various cycle peaks into sharp resolution. The typical approach is to use the Power Spectrum to identify the dominant cycle in your data and then set your moving average or oscillator to a period that is 1/2 of the dominant cycle. Works with intraday and daily data.
Specifications
- Product ID: SPEC03
- Study only, no source code provided
- Requires eSignal 12.x or newer