divergence software, inc.
Development & Consulting Services
Product Detail
Hi/Lo Bands

TradingView indicators will be activated for your TradingView account and no installation is required. eSignal indicators will be delivered to you via email in zip files. Some of the more complex indicators have installer programs. In most cases we will require your eSignal username so that we can set up the entitlement for the indicator(s) you have purchased.
The majority of our indicators are licensed for a one-time fee (i.e., non-recurring). However, we do have some subscription-based products, including marketDirection Monitor, Harmonic Pattern Collection, and S/R Analyst Pro.
Description
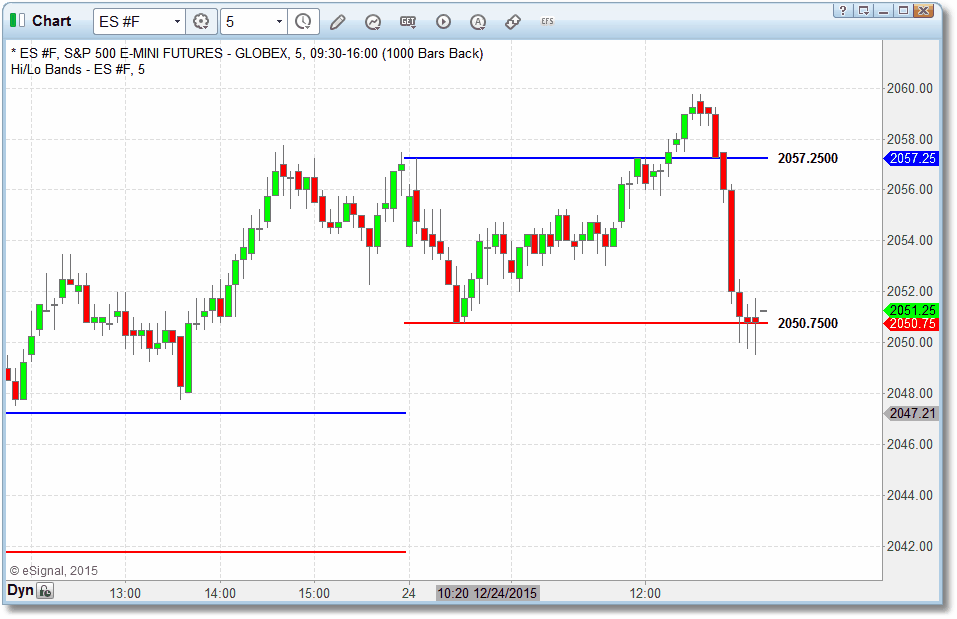
This is an intraday script that will track the highest-high and lowest-low traded during a specific period of time and plot those values as lines on the chart. So, for example, if you wanted to keep track of the highest-high and lowest-low traded between 9:30am and 11:00am, you would set the input parameters to 09:30 and 11:00 respectively and the bands would be plotted on the chart. During the tracking period (e.g., in the example that would be the time between 9:30am and 11:00am) the bands will self-adjust as new highs and/or lows are reached. The script will also work across the midnight boundary so it is possible, for example, to track the highest-high and lowest-low traded between 4:00pm and 3:00am if that is desired. Source code is provided so the calculations can be modified and integrated into other studies.
Specifications
- Product ID: GEN6
- Requires eSignal 12.x or newer