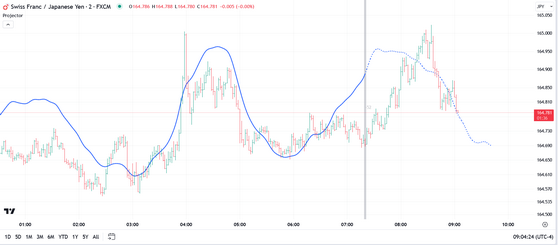
The cycleProjector for TradingView indicator is a companion product to our cycleAnalyzer product. It performs a forecasting function that is similar to the Composite plot option in cycleAnalyzer, but it makes use of more cycles and it plots the results in the price pane overlaying the price data instead of in an indicator pane.
In the example above, cycleProjector has been loaded into a chart with a Window Size of 256 and a Bar Offset of 52 bars. This means that the cycle analysis is being performed on the 256 bars that precede (and include) the offset bar. This is what we call our In-Sample period. cycleProjector knows nothing about the price bars that come after the Bar Offset, and this area after the offset is what we call our Out-of-Sample period.
After performing the cycle analysis, the indicator plots the resulting composite plot in the correct phase over the In-Sample period and it then projects the plot into the Out-of-Sample period. We can then study the composite plot to determine how well it fits the price data in the In-Sample period and, more importantly, how well it fits the price data in the Out-of-Sample period.
If we have a good fit then we can assume that the security we are charting is exhibiting cyclical behavior (i.e., the price action in the Out-of-Sample period is following the cyclical pattern that was extracted from the In-Sample period). We can also expect this behavior to continue for some period of time into the future. Thus, you can use cycleProjector to give you a heads-up in terms of where price might be heading in the future.
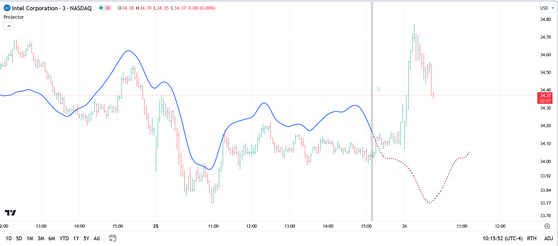
If we do NOT have a good fit (as in the snapshot below), then you can either try a different Bar Offset, or try viewing cycleProjector on the same security but using a different bar interval, or try a different Window Size.
When evaluating the composite plot, it is more important to pay attention to the direction of the plot, rather than the amplitude (scale) of the plot. So, as long as the peaks and troughs in the composite reasonably match the peaks and troughs in the price data then we have a good fit...it does not matter if the swing-size of the composite plot is larger (or smaller) than the swing-size in the price data.
As mentioned above, the process used in cycleProjector is similar to the Composite plot option in cycleAnalyzer. But where cycleAnalyzer only extracts the 3 strongest cycles, cycleProjector extracts all of the cyclical information. It will then filter out any weaker cycles that are at or below the relative amplitude value you have set in the Amplitude Filter settings option. Then it will create the composite plot by summing the remaining cycles in the correct phase and relative amplitude. The last step is to add back the trend component (if any) and plot the composite on the chart, and extend it into the future.
As with the cycleAnalyzer indicator, using a Bar Offset in cycleProjector is critical...if for no other reason than it provides you with an Out-of-Sample period that you can use to validate and verify the composite plot. If the plot fits well with the price data in the Out-of-Sample period then we have a good cyclical match which we can use for forecasting future price action. If not, then as mentioned above, we can try a different bar offset, Window Size, or timeframe to see if we can find a match.
In terms of selecting the 'correct' Bar Offset it is generally recommended to select a recent intermediate or major swing high or low in the price data as your offset. The Auto-Calc Bar Offset option in the menu does a good job of automating this process, but you can use the Manual Bar Offset option to accomplish the same thing, or to explore different offsets that the Auto-Calc Bar Offset option would not select. When you do find a good Bar Offset it is recommended that you then switch to Manual Bar Offset and input the selected offset. You should also check the Fixed Offset box so that this offset remains in place as new bars come in.
When the price data in the Out-of-Sample period stops tracking well with the composite plot, then it is probably a good time to select a new Bar Offset to begin the process all over again.
Typically a time series (i.e., price data) will either be trending or exhibiting cyclical behavior. And when the time series is exhibiting cyclical behavior, the cycles present in the data can change (sometimes rapidly) because of outside impetus. However, there are times when the cycle composition remains relatively static...often for long periods of time, and it is in these situations that cycleProjector can do a very accurate job of mapping out where price is likely to travel relative to the current price.


