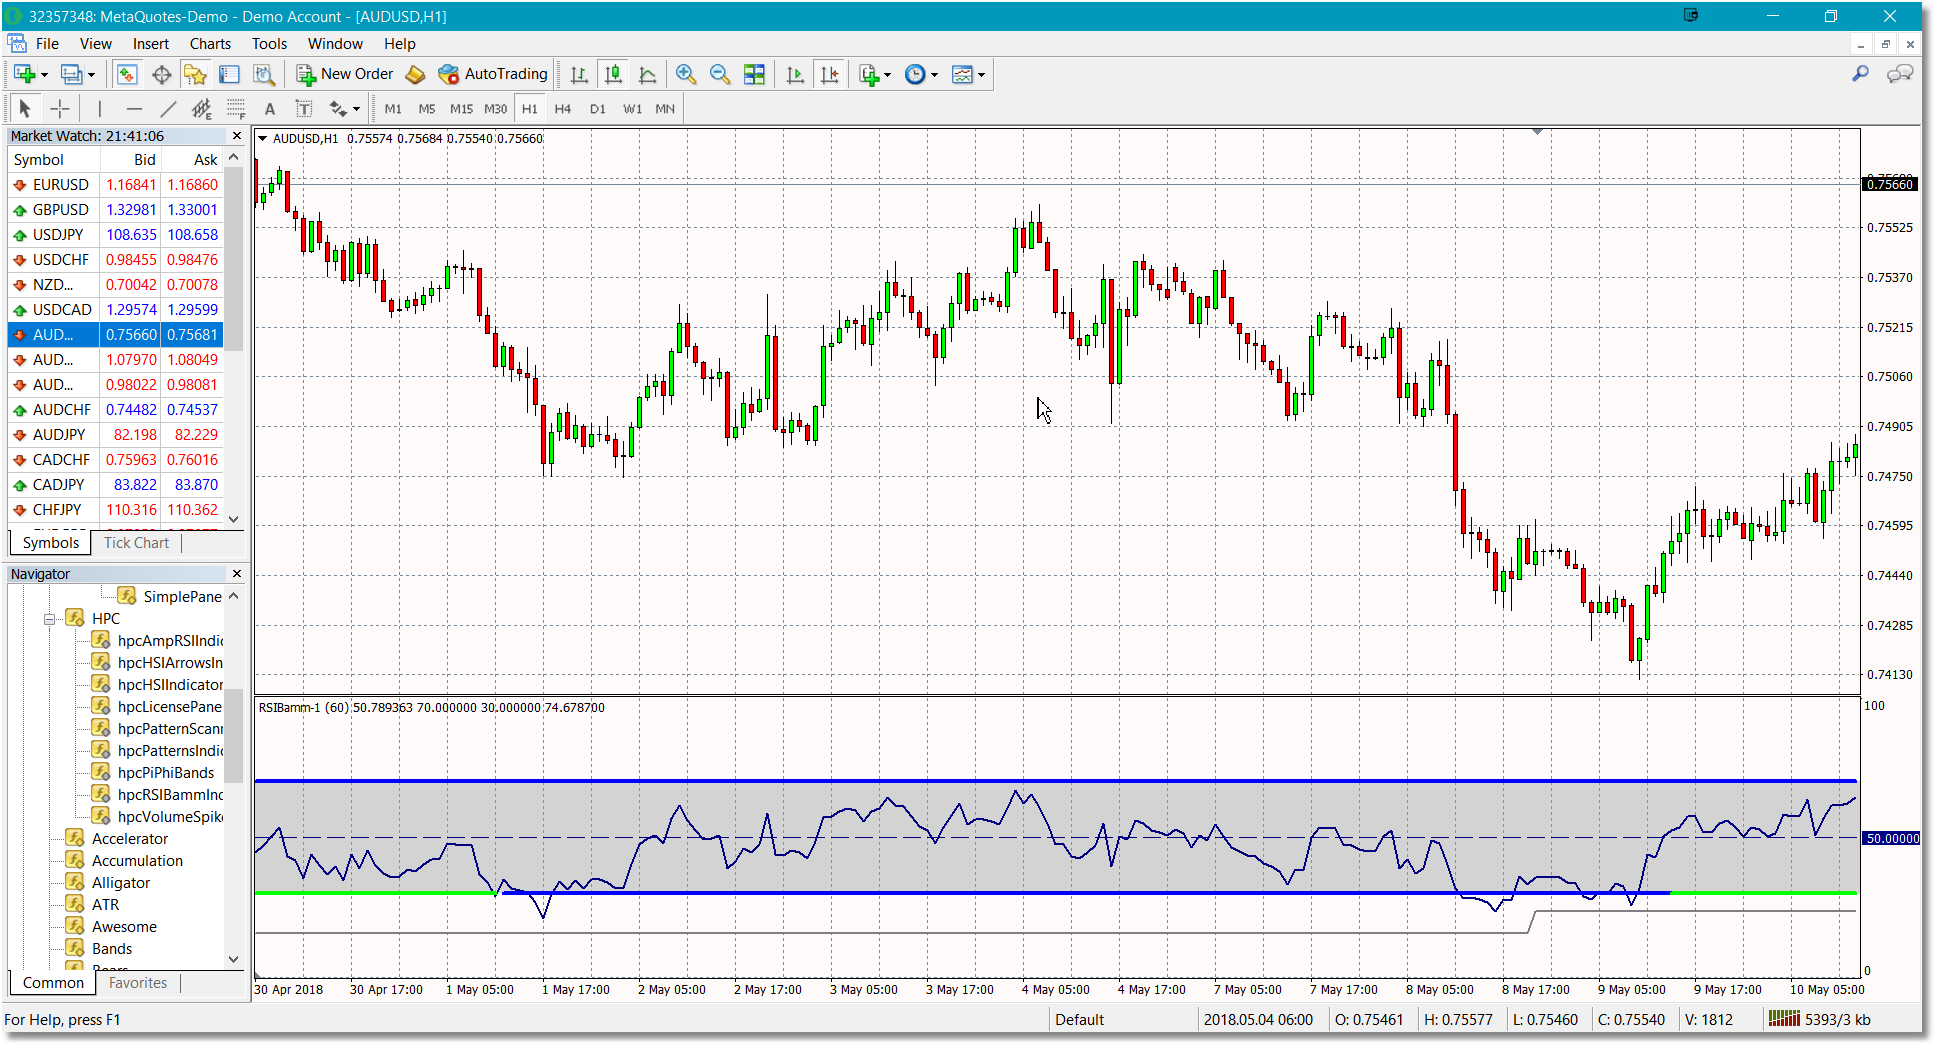
RSI Bamm is an enhanced version of Relative Strength Index that incorporates the exact specifications for complex structure identification in RSI and automatically identifies these scenarios by highlighting the overbought or oversold to indicate their presence. As defined in The Harmonic Trader: Volume II and Volume III, RSI Bamm is identified when a complex structure has occurred above 70 or below 30, and RSI returns to the 50 level.
RSI Bamm identifies these special-opportunity scenarios by highlighting the respective overbought or oversold boundary until it has been retested by RSI.
To load the RSI Bamm indicator into a chart:
•Look at the left-hand side of your MT4 program window and you should see the Navigator pane. Use the scrollbar to scroll up/down until you see the HPC folder. Click on the (+) icon to open the HPC folder. You should now see the list of all of the Harmonic Pattern Collection indicators. Note that if the Navigator pane is NOT displayed, just select the View option from the main MT4 menu and then select the Navigator option.
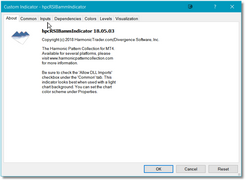
•Double-click on the hpcRSIBammIndicator and the Custom Indicator dialog will be displayed.
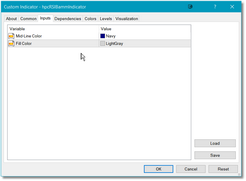
•It will most likely be on the About screen. To access the indicator inputs, just click on the Inputs tab.
•Adjust the parameters as needed and then click on the OK button. The RSI Bamm Indicator will now be loaded into your workspace.
See Also:


