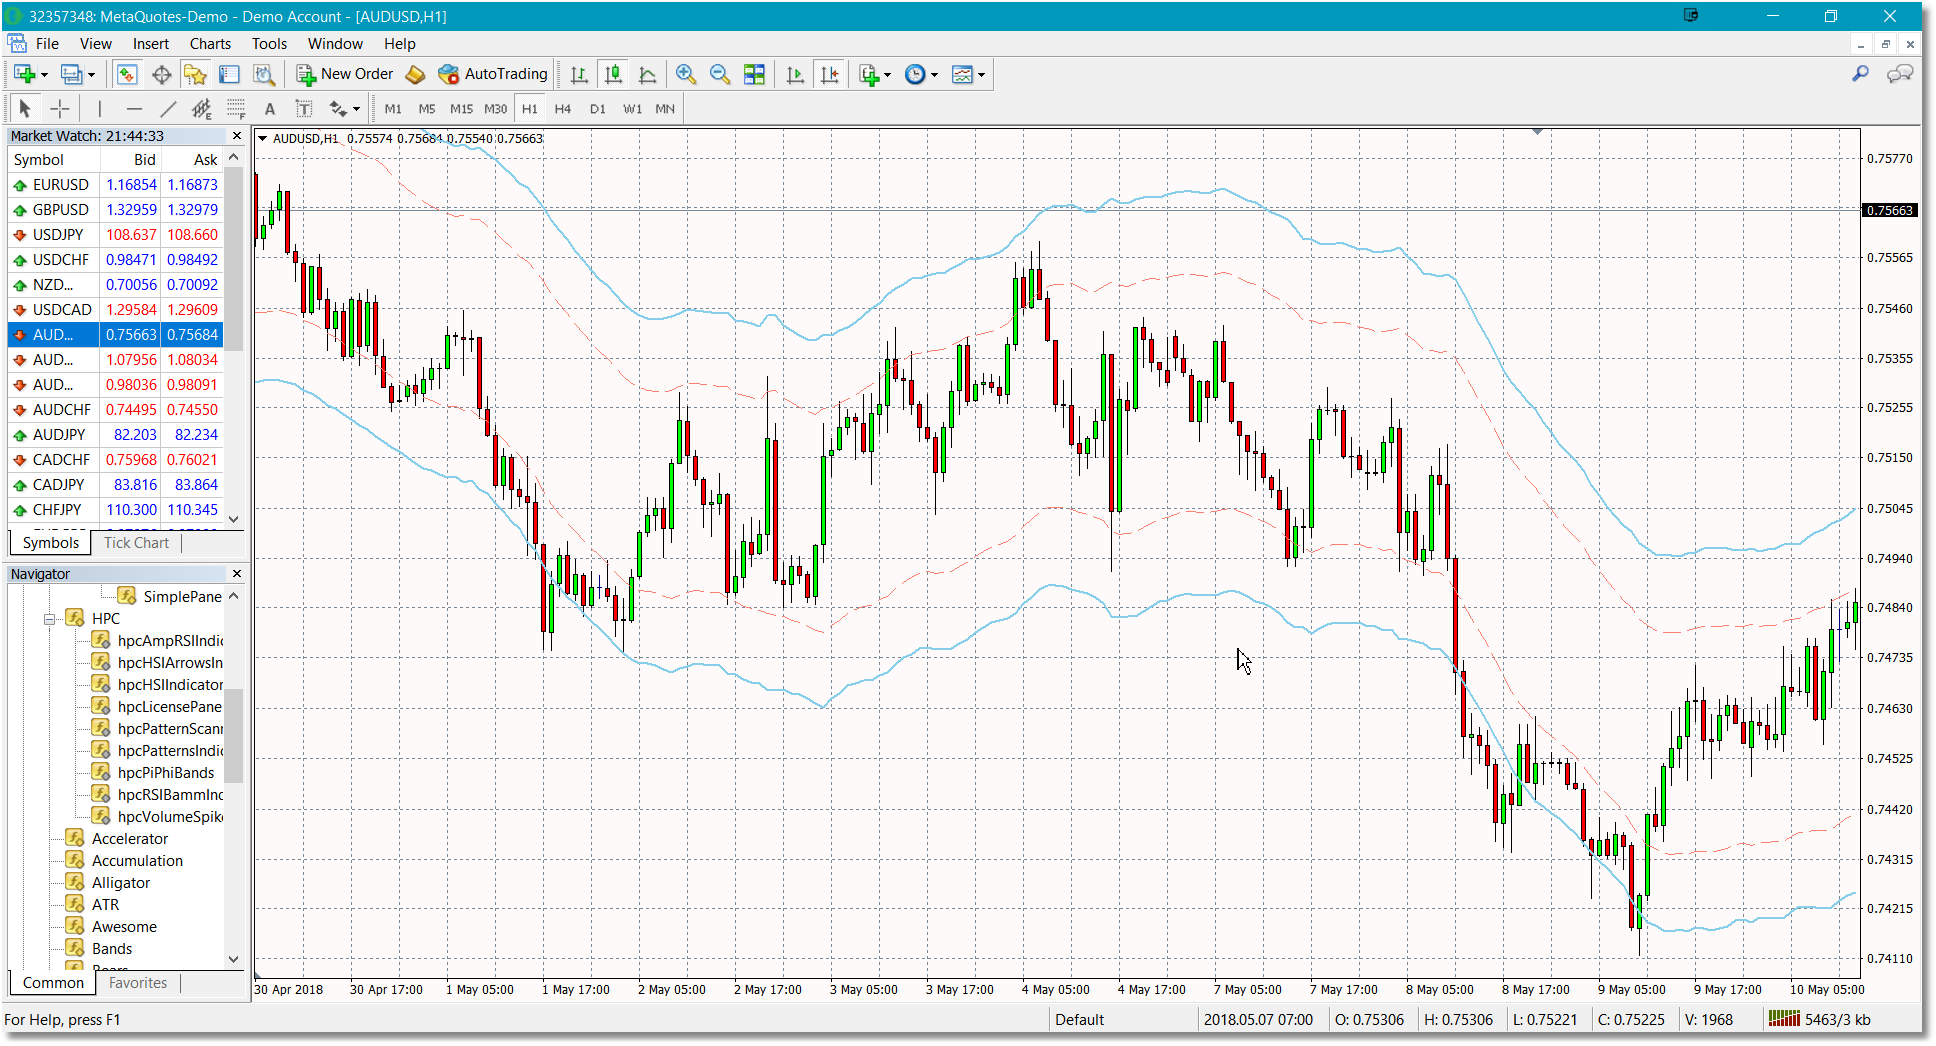
The Pi Phi Bands identify the “harmonic range” in which price is oscillating, creating a simple way to identify when price is trending into extreme territory. Although a touch of a band does not necessarily indicate exhaustion in price, it is a good place to start looking.
The most reliable signal we have found in Pi Phi Bands is to look for price to hug one band for an extended period of time and then to anticipate a quick reaction off of the opposing band when price finally connects with it. For instance, if price hugs the upper band for several days on the fifteen minute chart, we would look for price to react quickly when it finally touches down to the lower band. An extended return to an indecisive range in the middle of the bandwidth would negate this signal.
To load the Pi Phi Bands into a chart:
•Look at the left-hand side of your MT4 program window and you should see the Navigator pane. Use the scrollbar to scroll up/down until you see the HPC folder. Click on the (+) icon to open the HPC folder. You should now see the list of all of the Harmonic Pattern Collection indicators. Note that if the Navigator pane is NOT displayed, just select the View option from the main MT4 menu and then select the Navigator option.
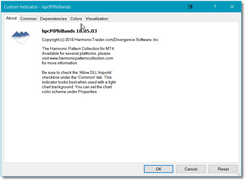
•Double-click on the hpcPiPhiBands and the Custom Indicator dialog will be displayed.
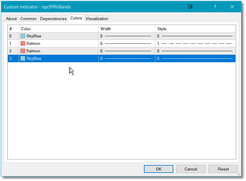
•It will most likely be on the About screen. There are no standard inputs. To access the plot colors, just click on the Colors tab.
•Adjust the colors as needed and then click on the OK button. The Pi Phi Bands Indicator will now be loaded into your workspace.


