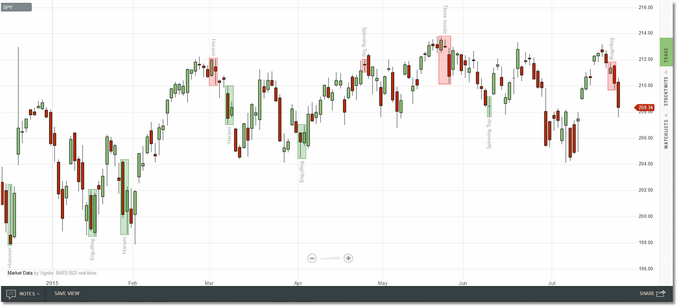
The Candle Patterns indicator is an overlay in Technician that will identify bullish and bearish instances of 18 of the most popular candlestick patterns. You can select which patterns you wish to see (the default is for all of them to be active) and you can also select to see only bullish patterns or only bearish patterns. When a pattern is identified, the bars involved in the pattern are outlined and the region is shaded (you can toggle these features on/off) and the name of the pattern is drawn above a bearish pattern and below a bullish pattern.

Candle Patterns indicator running on a daily SPY chart.
The available candlestick patterns are:
•Breakaway
A five-candlestick pattern, occurs in both bull and bear markets. Usually forecasts a change in trend. |
|
•Three Line Strike
A four-candlestick continuation pattern that is most meaningful when seen in a clear up-trend or down-trend. Occurs in both bull and bear markets. |
|
•Three Outside
A three-candlestick reversal pattern beginning with an engulfing pattern followed by a close beyond the engulfing pattern. Occurs in both bull and bear markets. |
|
•Three Inside
A three-candlestick reversal pattern that confirms a bullish or bearish Harami pattern. Occurs in both bull and bear markets. |
|
•Gap
A three-candlestick continuation pattern. Occurs in both bull and bear markets (Upside and Downside Gap). |
|
•Tasuki Gap
A three-candlestick continuation pattern. Occurs in both bull and bear markets. |
|
•Tri Star
A three-candlestick (3 doji candles) reversal pattern. |
|
•Star
A three-candlestick reversal pattern. Occurs in both bull and bear markets (Morning Star and Evening Star) |
|
•Three Soldiers/Crows
A three-candlestick pattern that predicts the reversal of the current trend. Occurs in both bull and bear markets (Three Soldiers and Three Crows)
|
|
•Kicking
A two-candlestick reversal pattern with no trend requirement. Bullish Kicking is a down marubozu followed by a up marubozu and vice-versa for a Bearish Kicking. |
|
•Engulfing
A very common two-candlestick reversal pattern where the second candle engulfs the first. Most meaningful if found after a sustained up-trend or down-trend. Occurs in both bull and bear markets. |
|
•Piercing Line
Similar to a bullish engulfing pattern, this is a two-candlestick bullish reversal pattern where the second candle gaps down but then closes above the midpoint of the first candle. |
|
•Dark Cloud
Similar to a bearish engulfing pattern, this is a two-candlestick bearish reversal pattern where the second candle gaps up but then closes below the midpoint of the first candle. |
|
•Doji Star
A two-candlestick reversal pattern which occurs in both bull and bear markets. As with the engulfing pattern, it is more meaningful if found during a clear up-trend or down-trend. |
|
•Harami
A very common two-candlestick reversal pattern where the second candle is engulfed by the first candle. Indicates at least a short-term reversal in trend. Occurs in both bull and bear markets. |
|
•Harami Cross
A two-candlestick reversal pattern where the second candle (a doji) is engulfed by the first candle. Occurs in both bull and bear markets.
|
|
•Hammer/Hanging Man
A one-candlestick pattern consisting of a small body and a long shadow. Occurs in both bull and bear markets. |
|
•Shooting Star
A one-candlestick reversal pattern consisting of a small body and a long shadow. Occurs during an uptrend and indicates a potential reversal. |
|
•Spinning Top
A one-candlestick pattern consisting of a small body and two long shadows. Occurs in both bull and bear markets and can be a reversal OR a continuation pattern. |
The Candle Patterns indicator will operate on any bar interval/custom period available in Technician.
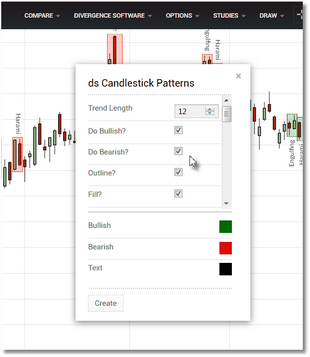
The Candle Patterns indicator has a number of parameters that can be adjusted, which you can access via the parameters dialog once the indicator has been loaded. See the Settings section for a complete description of all of the available parameters.
Make your settings changes and then click on the
Create button to apply them to the overlay.
See Also:


