divergence software, inc.
Development & Consulting Services
Product Detail
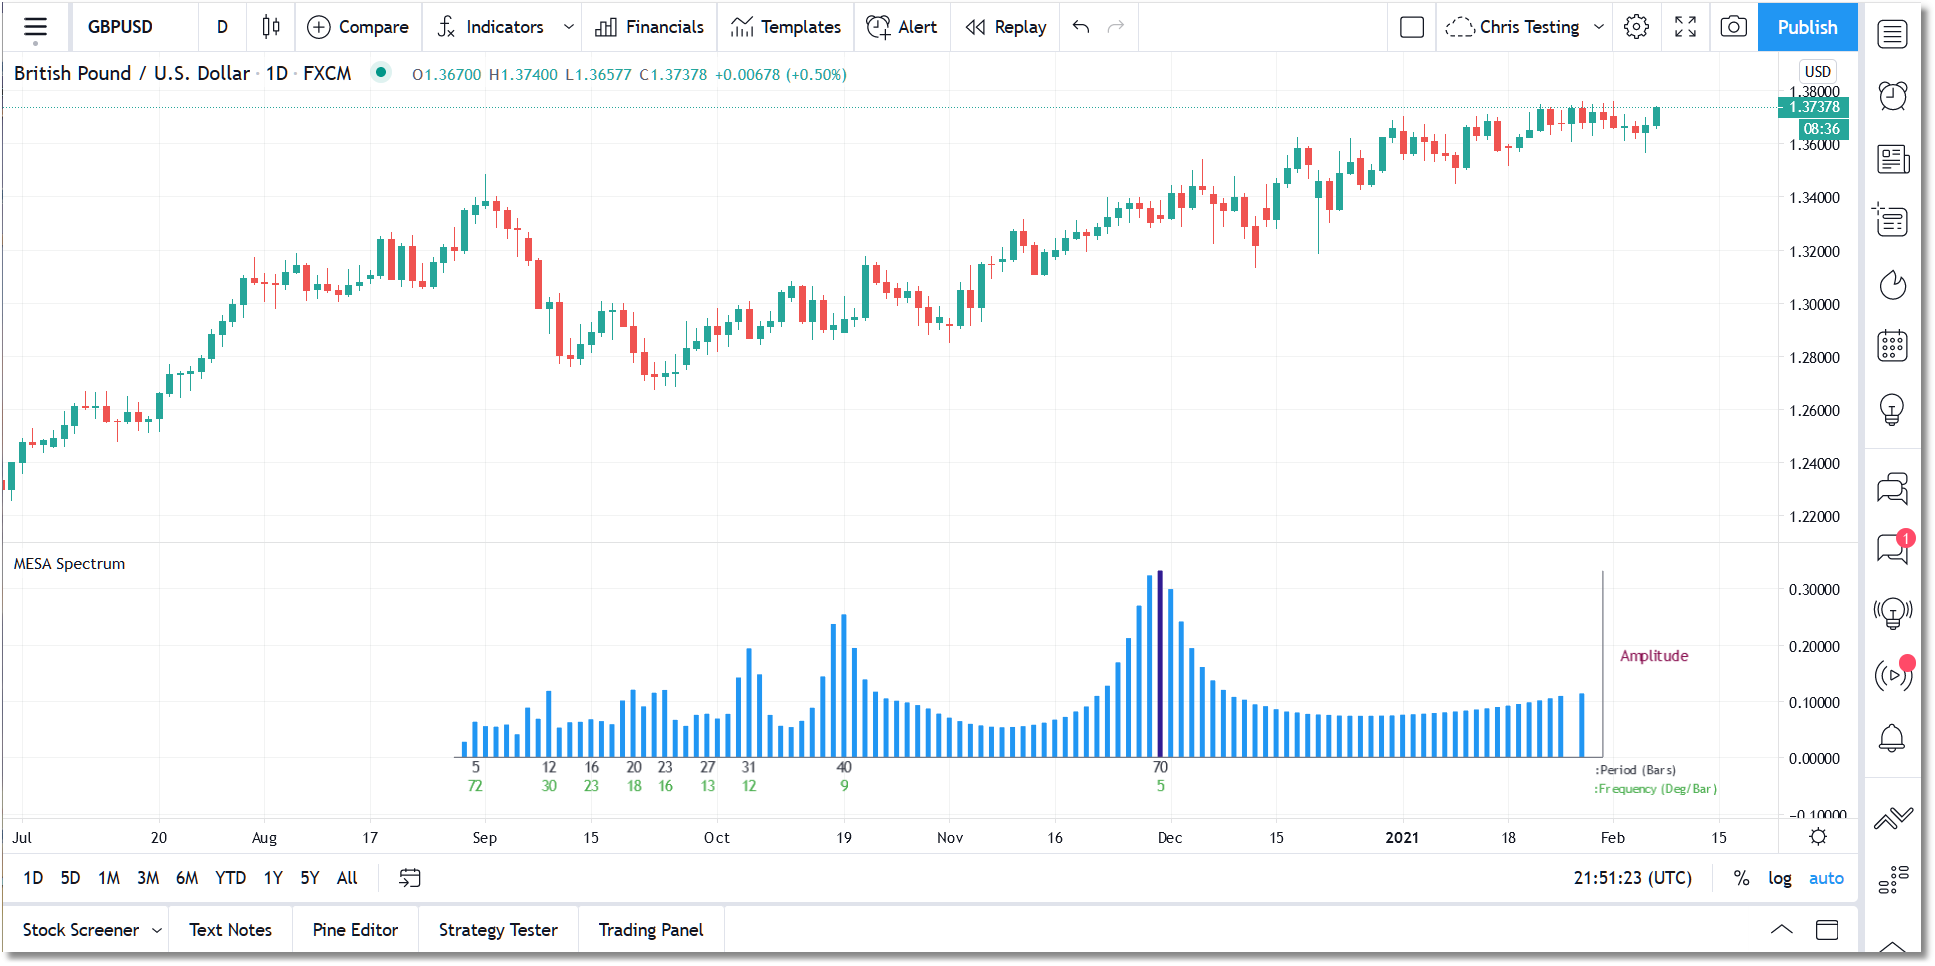
MESA Spectrum for TradingView
TradingView indicators will be activated for your TradingView account and no installation is required. eSignal indicators will be delivered to you via email in zip files. Some of the more complex indicators have installer programs. In most cases we will require your eSignal username so that we can set up the entitlement for the indicator(s) you have purchased.
The majority of our indicators are licensed for a one-time fee (i.e., non-recurring). However, we do have some subscription-based products, including marketDirection Monitor, Harmonic Pattern Collection, and S/R Analyst Pro.
Description
This indicator calculates the power spectrum of a data series using the Maximum Entropy Spectrum Estimation method and produces a power spectrum plot. The Maximum Entropy algorithm, unlike a simple FFT transform, will include frequencies from the entire complex frequency plane and not just the Nyquist interval which, in general terms, means that it can resolve cycle periods that are larger than the data window passed to the function. In addition, MESA has the ability to fit very sharp spectral features which are often missed by other analysis methods. The displayed power spectrum will highlight the dominant cycles and frequencies within the data and will display the Period and Frequency below each peak. Prior to being passed to the MESA algorithm, the price data is detrended using a least means squared filter.
Specifications
- Product ID: TV0019
- Study only, no source code provided
- Requires TradingView