divergence software, inc.
Development & Consulting Services
Product Detail
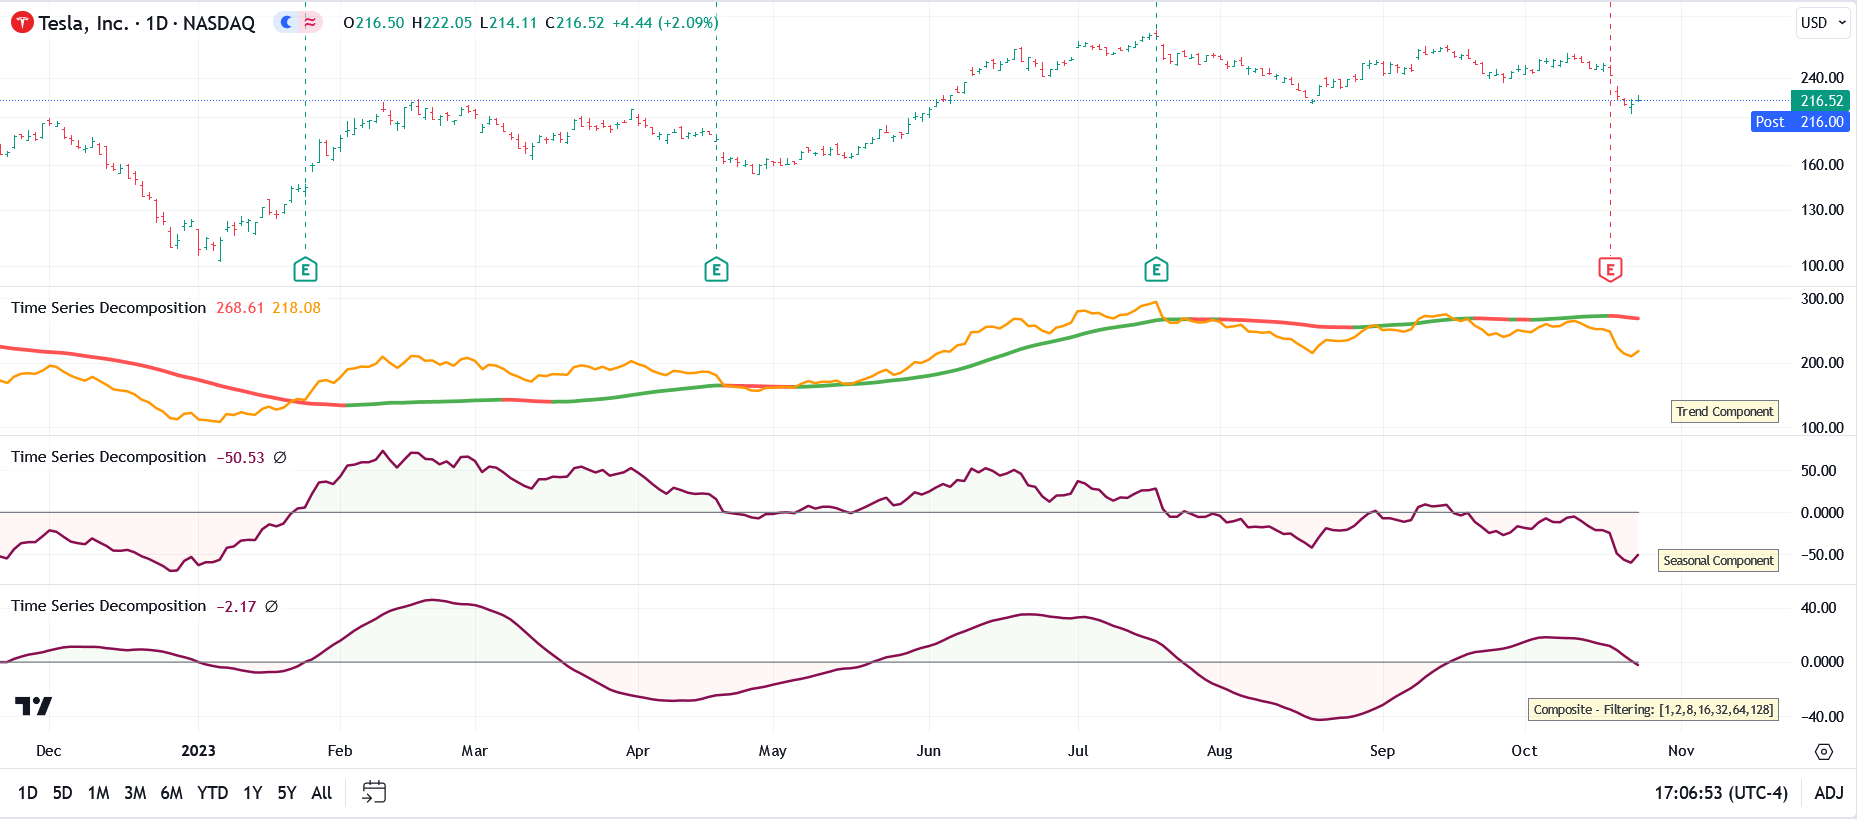
Time Series Decomposition for TradingView
TradingView indicators will be activated for your TradingView account and no installation is required. eSignal indicators will be delivered to you via email in zip files. Some of the more complex indicators have installer programs. In most cases we will require your eSignal username so that we can set up the entitlement for the indicator(s) you have purchased.
The majority of our indicators are licensed for a one-time fee (i.e., non-recurring). However, we do have some subscription-based products, including marketDirection Monitor, Harmonic Pattern Collection, and S/R Analyst Pro.
Description
The Time Series Decomposition indicator uses wavelet technology (specifically a Haar wavelet forward and inverse transform) to separate the selected time series into its component parts.
The Haar wavelet transform breaks down information into two parts:
1. Averages: A smoothed-out, general view.2. Differences: How each piece of data deviates from that smooth view.
When you apply the Haar wavelet transform repeatedly, you further break down those averages into more averages and differences, again and again, until you reach a level of detail you're satisfied with.
Financial data, like stock prices, can be thought of as having multiple layers:
1. Trend: The general direction in which a stock is moving over a long period.2. Seasonality: Regular ups and downs that happen due to known events, like earnings announcements.
3. Noise or Residuals: Random fluctuations that can't be easily attributed to any known factor.
Using the Haar wavelet transform, we can separate stock price data into these layers:
- The coarsest (broadest) averages show us the trend.- The mid-level details serve to highlight seasonality.
- The finest level details (and differences) often represent noise.
By analyzing these components separately, we can:
1. Filter Out Noise: To make predictions or understand the real movement without daily fluctuations.2. Detect Patterns: By focusing on seasonality, one might detect patterns related to specific events.
3. Event Detection: Sudden spikes in the finest details could indicate market reactions to unforeseen events.
By understanding each layer, you can make more informed decisions about investments, trading strategies, and risk management.
In the Time Series Decomposition indicator, all of this is automated. In the indicator menu you can select from:
Trend Component: This would be the coarsest level of the data (the last few coefficients from the transformed data) and these coefficients represent the low-frequency components (i.e., the long-term trend)Seasonal Component: This would be the middle-level coefficients and they represent fluctuations in the data that aren't as fast as noise but aren't as slow as trends.
Residual Component: The finest scale, or the first few coefficients from the transformed data, would represent the high-frequency noise.
Composite: This is a custom transform that allows you to filter out specific components to create a customized view of the data. The sets of coefficients that can be filtered out are 1,2,4,8,16,32,64 and 128. The lowest frequency components are represented in coefficient set 1 while the highest-frequency components are represented in coefficient set 128.
Specifications
- Product ID: TV0052
- Study only, no source code provided
- Requires TradingView